
TL;DR:
- Retirement risk profiles classify investment tolerance to ensure income lasts long enough.
- Matching asset allocation to these profiles helps balance growth, inflation protection, and volatility.
Retirement risk profile categories classify how much investment risk you are prepared and able to take, directly shaping the portfolio choices that determine whether your money lasts as long as you do. In Australia, the standard framework for this classification is the Standard Risk Measure, which ranks investment options across seven risk bands from Very Low to Very High. Getting your risk profile right matters more in retirement than at any other stage of your financial life. The wrong category can leave you either running out of money too soon or missing the growth you need to stay ahead of inflation over a 20 to 30 year retirement.
1. What are the retirement risk profile categories under the Standard Risk Measure?
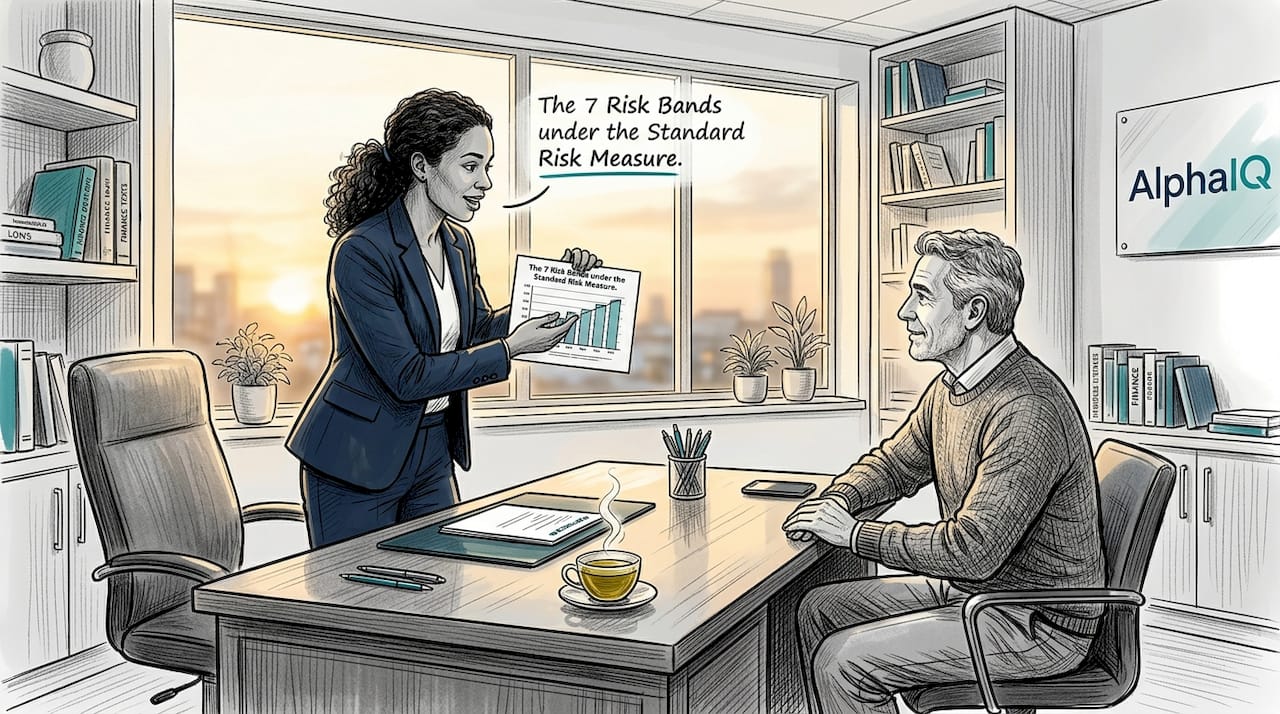
Australian super funds classify investment options using the Standard Risk Measure across seven risk bands, based on the estimated number of negative return years over a 20-year period. This gives you a consistent, comparable way to assess risk across different funds and options.
| Risk band | Label | Estimated negative years (over 20) | Typical asset mix |
|---|---|---|---|
| 1 | Very Low | Less than 0.5 | Cash, term deposits |
| 2 | Low | 0.5 to less than 1 | Mostly defensive, some bonds |
| 3 | Low to Medium | 1 to less than 2 | Bonds, some property |
| 4 | Medium | 2 to less than 3 | Balanced: bonds and equities |
| 5 | Medium to High | 3 to less than 4 | More equities, some defensive |
| 6 | High | 4 to less than 6 | Predominantly equities |
| 7 | Very High | 6 or more | Almost entirely growth assets |
Risk band 1 carries fewer than 0.5 negative return years over 20. Risk band 7 carries six or more. That gap represents a significant difference in both volatility and long-term growth potential.
The Standard Risk Measure has one important limitation for retirees: it measures frequency of negative returns, not the magnitude of losses. A portfolio in band 6 could lose 25% in a bad year or 5%. The label alone does not tell you that. Use the SRM as a starting point, not the final word on your risk exposure.
Pro Tip: Compare the SRM band of your current super investment option against your actual asset allocation. Many retirees discover they are sitting in a Medium to High fund without realising it.
2. How broader retirement risks shape your risk profile
Market volatility is only one of five risk categories that retirement planning in 2026 requires you to manage. Understanding all five helps you choose a risk profile that genuinely fits your situation.
- Longevity risk. You may live longer than your money. A 65-year-old Australian woman has a median life expectancy past 87, which means a retirement portfolio needs to last more than 20 years in most cases.
- Market risk. Portfolio values fluctuate with share markets, property, and interest rates. This is the risk most people focus on, but it is rarely the most dangerous one in isolation.
- Inflation risk. Prices rise over time. A portfolio sitting entirely in cash or term deposits loses purchasing power steadily. Relying solely on safe assets in retirement can erode your standard of living over a long retirement.
- Health and aged care risk. Unexpected medical costs or residential aged care fees can require large, unplanned capital withdrawals. This risk increases significantly after age 80.
- Legislative risk. Super rules, tax treatment, and pension eligibility can change. The 2016 super reforms and subsequent changes to transfer balance caps are recent examples of how policy shifts affect retirement income.
Sequencing risk deserves special attention. It refers to the danger of experiencing large market losses in the first five to ten years of retirement while you are drawing down capital. A 30% loss in year two of retirement does far more damage than the same loss in year fifteen, because you have fewer assets left to recover. Sequencing risk, rather than average volatility, is the dominant threat to portfolio survival over 25 to 30 years.
3. Risk tolerance vs. risk capacity: why both define your profile
Risk profiling requires a dual assessment: your risk tolerance and your risk capacity. Confusing the two leads to portfolios that either feel uncomfortable or are genuinely unsuitable.
Risk tolerance is your emotional comfort with volatility. It is the feeling you get when you watch your super balance drop $50,000 in a month. Some people can hold steady. Others panic and sell, locking in losses permanently.
Risk capacity is your financial ability to absorb losses without derailing your retirement. If you have a defined benefit pension, rental income, or significant cash reserves, you can absorb a market downturn without selling growth assets at the wrong time. If your super is your only income source, your capacity to absorb losses is lower, regardless of how calm you feel about volatility.
Common mistakes include:
- Overestimating tolerance because markets have been rising for years
- Underestimating capacity because you focus on the balance number rather than your actual income needs
- Treating your risk profile as permanent rather than reviewing it as your circumstances change
Scenario-based questionnaires are the most reliable way to assess both dimensions. They present realistic market downturn scenarios and ask what you would do, which reveals behavioural responses that simple attitude questions miss. For Australians aged 50 to 65, the focus shifts from accumulation to a preservation-and-growth mindset. Your profile should reflect that transition, not the one you held at 40.
Pro Tip: Review your risk profile every two years and after any major life event: retirement, a health diagnosis, a significant inheritance, or a market correction exceeding 20%.
4. Portfolio strategies matched to each risk profile category
No single asset allocation fits every retiree. The right mix depends on your risk profile, time horizon, and spending habits. The table below shows typical portfolio structures across the main retirement risk profile categories.
| Profile category | Defensive assets | Growth assets | Typical annual withdrawal range | Key characteristic |
|---|---|---|---|---|
| Conservative | 70–85% | 15–30% | 4–5% | Capital preservation priority |
| Balanced | 50–70% | 30–50% | 4–5% | Income and moderate growth |
| Growth | 30–50% | 50–70% | 3.9–4.5% | Long-term real returns |
| Aggressive | 10–30% | 70–90% | 3.5–4% | Maximum long-term growth |
Australian retirement research suggests a maximum safe starting withdrawal rate of approximately 3.9% for new retirees assuming a 30-year capital duration and a 90% success probability. That figure updates the traditional 4% rule for Australian conditions and longer life expectancies.
Government-mandated minimum drawdown rates for super pensions increase with age: 4% at ages 65 to 74, rising to 14% at age 95 and over. These rates set a legal floor, but you do not have to spend the full amount withdrawn. Holding the excess in a cash buffer outside super protects your portfolio from forced asset sales during market downturns.
The bucket strategy is the most practical way to manage income across risk profiles. You allocate one to two years of living expenses in cash, three to seven years in defensive income assets, and the remainder in growth assets for the long term. The bucket approach advises maintaining 20–40% in growth assets even in retirement, because inflation risk compounds over decades. A conservative retiree who holds no growth assets at 65 may find their purchasing power significantly reduced by 80.
Annuities can also play a role for conservative and balanced profiles. A lifetime annuity provides guaranteed income regardless of market conditions, which reduces sequencing risk and simplifies income planning for retirees who want certainty over flexibility.
Pro Tip: Separate your minimum drawdown withdrawal from your actual spending plan. Park the excess in a high-interest savings account outside super. This gives you a buffer without forcing you to sell growth assets in a down market.
Key takeaways
Choosing the right retirement risk profile category requires balancing your emotional comfort with volatility, your financial capacity to absorb losses, and your need for growth to outlast inflation over a 20 to 30 year retirement.
| Point | Details |
|---|---|
| Use the Standard Risk Measure | The SRM's seven bands give you a consistent baseline for comparing super investment options. |
| Assess both tolerance and capacity | Emotional comfort and financial resilience are separate factors; both must inform your profile. |
| Sequencing risk is the biggest threat | Losses in the first five to ten years of retirement do more damage than losses later. |
| Maintain some growth assets | Even conservative retirees need 20–40% in growth assets to protect against inflation over decades. |
| Review your profile regularly | Life events and market shifts can change both your tolerance and your capacity; update accordingly. |
Why most retirees get their risk profile wrong
The most common mistake I see is retirees shifting to a conservative profile the moment they stop working, then wondering why their balance is not keeping pace with their cost of living five years later. The instinct to protect what you have built is completely understandable. But abandoning growth assets at 65 when you may live to 90 is not caution. It is a different kind of risk.
The second mistake is treating a risk profile as a one-time decision. Your financial position at 60 looks nothing like it will at 72. Health costs rise, spending patterns shift, and legislative changes alter the rules. A profile that suited you at the start of retirement may be entirely wrong a decade in.
What actually works is building flexibility into your income structure from day one. The bucket strategy is not just a portfolio technique. It is a psychological tool. When you know your next two years of expenses are sitting in cash, you can hold your growth assets through a market correction without panic. That behavioural resilience is worth more than any marginal improvement in asset allocation.
The five-pronged risk framework used by experienced retirement planners is a better mental model than the single-axis volatility scale most people use. When you think about longevity, inflation, sequencing, health, and legislative risk together, the right profile becomes clearer. You stop asking "how much risk can I tolerate?" and start asking "what does my money need to do, and for how long?"
Technology now makes scenario modelling accessible without a financial adviser. Running projections across different risk profiles and drawdown rates gives you real numbers to work with, not guesses. That kind of clarity changes how you make decisions.
— Jonathan
Model your retirement risk profile with Alphaiq
Alphaiq is built for Australians aged 35 to 65 who want real numbers behind their retirement decisions, not generic advice.

The Alphaiq platform combines tax-aware financial modelling with scenario simulation across superannuation, investments, and retirement income. You can model different risk profiles, run drawdown projections against the government-mandated minimum rates, and see how your super balance holds up across conservative, balanced, and growth allocations. The superannuation calculator projects your retirement position using your actual figures, giving you a clear picture of where you stand and what adjustments would make the biggest difference. No ongoing advice fees. Just clear, personalised modelling you can act on.
FAQ
What are the main retirement risk profile categories in Australia?
Australian super funds use the Standard Risk Measure to classify investment options into seven bands from Very Low (band 1) to Very High (band 7), based on estimated negative return years over 20 years. In practice, most retirees sit within the Conservative, Balanced, or Growth categories.
How do I assess my retirement risk profile?
A retirement risk assessment evaluates both your risk tolerance (emotional comfort with market falls) and your risk capacity (financial ability to absorb losses without affecting your income). Scenario-based questionnaires are the most reliable method for assessing both dimensions accurately.
What is sequencing risk and why does it matter?
Sequencing risk is the danger of experiencing large market losses in the early years of retirement while drawing down capital. Losses in the first five to ten years do disproportionate damage to portfolio longevity compared to the same losses occurring later in retirement.
Should retirees hold any growth assets in a conservative profile?
Retirement strategies generally recommend maintaining 20–40% in growth assets even within conservative profiles, because inflation erodes purchasing power over a 20 to 30 year retirement. Holding only defensive assets increases inflation risk significantly.
How often should I review my retirement risk profile?
Your risk profile should be reviewed at least every two years and after any significant life event, including retirement, a health change, a major market correction, or a shift in your income needs or financial position.