
Property portfolio cash flow modelling is the process of forecasting income, expenses, debt service, and net returns across every asset you hold, then rolling those figures into one consolidated view you can stress test. The recommended starting approach is straightforward: build a standardised pro-forma for each property, then aggregate those sheets into a single portfolio roll-up with a scenario layer sitting on top.
That structure matters more than which formula you choose first. A model built asset-by-asset with inconsistent categories will fall apart the moment you try to compare properties or test a rate rise across the whole portfolio.
Your immediate action, before reading any further, is this:
- Open Excel and create one tab per property using identical row labels for income, expenses, and debt.
- Add a consolidated roll-up tab that sums each pro-forma by category and period.
- Layer in a scenario tab that flexes vacancy, interest rates, and rent growth without touching the base inputs.
Everything else in this article builds on that skeleton.
Key Takeaways
Reliable portfolio cash flow modelling depends on standardised per-property pro-formas, consistent timing conventions, and a stress-tested scenario layer, not on any single formula.
| Point | Details |
|---|---|
| Standardise before you scale | Use identical row labels and timing across every property tab so the portfolio roll-up sums cleanly. |
| Combine model types | Use DCF for hold/sell decisions, cash-on-cash for income focus, and direct capitalisation as a quick cross-check. |
| Separate debt from operations | Build a dedicated amortisation schedule per loan, including refinancing and rate reset triggers. |
| Stress test compounding shocks | Run a severe downside scenario combining a rate rise and vacancy spike, not just isolated sensitivities. |
| Layer tax adjustments separately | Alphaiq applies tax-aware and retirement-aware adjustments on top of the operating model, keeping cash flow and tax views auditable. |
Table of Contents
- What are the core cash flow modelling methods for property portfolios?
- What inputs does a portfolio cash flow model need?
- How do you build a scalable Excel portfolio model?
- How do you calculate consolidated portfolio metrics?
- How do you stress test a property portfolio model?
- What are the most common cash flow modelling mistakes?
- What does a practitioner's portfolio model actually look like?
- Why most portfolio models fail before the stress test even starts
- Model your own portfolio with AlphaIQ
- Frequently asked questions
- Sources
What are the core cash flow modelling methods for property portfolios?
Three modelling approaches dominate property investment modeling, and each answers a different question. Confusing them is one of the more common mistakes analysts make when scaling from one property to a portfolio.
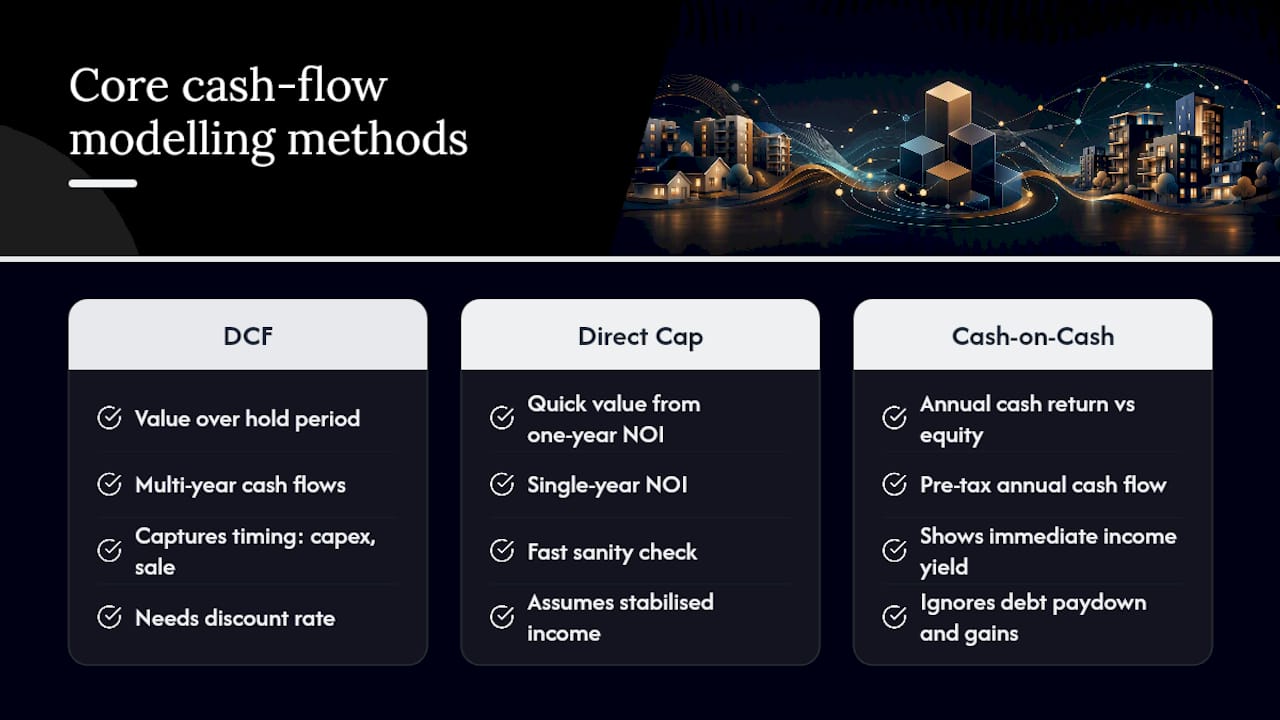
Discounted cash flow (DCF) projects income and expenses over a multi-year hold period, typically five to ten years, then discounts those future cash flows back to a present value using a required rate of return. DCF is the right tool when you're deciding whether to hold, sell, or acquire, because it captures the timing of capex, lease rollovers, and eventual sale proceeds rather than treating the property as a static snapshot.
Direct capitalisation divides a single year's net operating income (NOI) by a market capitalisation rate to estimate value. It's fast, and it's a legitimate sanity check against a DCF output or a broker appraisal, but it assumes stabilised, unchanging income. Use it as a cross-check, never as your primary decision tool for a property with lease expiries, planned renovations, or lumpy capex ahead.
Cash-on-cash return measures the annual pre-tax cash flow against the actual cash invested (deposit, costs, initial capex). It's the metric that matters most if your priority is passive income property analysis rather than long-term appreciation. It ignores the debt paydown and any capital gain, so it will always look more conservative than an IRR figure over the same hold.
The practical answer isn't to pick one. It's to combine them in a single workbook: DCF for the hold/sell decision, cash-on-cash for the here-and-now income check, and direct capitalisation as a quick valuation cross-reference whenever a new acquisition or refinance is on the table.
Pro Tip: Keep your DCF and cash-on-cash calculations on the same tab, pulling from identical input cells. If they disagree by more than a percentage point or two after adjusting for financing, one of your assumptions is wrong, not the model itself.
What inputs does a portfolio cash flow model need?
Every reliable model rests on the same handful of inputs, structured consistently across every property. Get the categorisation wrong here and every downstream metric, from NOI to IRR, inherits the error.
- Rent roll and income assumptions. List current rent per unit or property, lease expiry dates, and a realistic vacancy allowance (commonly 3 to 8 percent depending on asset type and location). Model rent growth separately from turnover assumptions. A property with high tenant turnover needs a re-leasing cost and downtime assumption baked in, not just an average vacancy percentage smoothed across the year.
- Operating expense classification. Split expenses into fixed (council rates, insurance, land tax) and variable (utilities, repairs, property management fees, typically 7 to 10 percent of rent). Separate recoverable outgoings, the ones a tenant reimburses under a commercial lease, from non-recoverable ones. Blending the two overstates your true net position.
- Capex scheduling and reserves. Capital expenditure isn't an annual expense, it's a lumpy, multi-year event: a roof at year 12, air conditioning at year 8, a kitchen renovation between tenancies. Build a capex schedule by asset and age, then size a reserve, often 1 to 3 percent of gross rent annually, that smooths those spikes into the monthly forecast rather than letting them blow a single quarter's cash flow.
- Debt modelling. Every loan needs its own amortisation schedule showing interest and principal split by period, because interest is deductible in most tax regimes while principal reduction isn't. Layer refinancing triggers explicitly, a rate reset date, an interest-only period expiring, or a loan-to-value covenant, so the model shows the cash flow impact before it happens rather than after.
- Tax adjustments. Cash flow and taxable income diverge because of depreciation and interest deductibility. The Australian Taxation Office's guidance on claiming rental expenses sets out what can be deducted and how apportionment works, and that distinction should flow through as a separate adjustment line rather than get buried inside your operating expenses.
A few structural habits keep this from becoming unwieldy:
- Use consistent period conventions (monthly for operations, annual for valuation and tax) across every property tab.
- Never hardcode a growth rate or expense ratio into a formula. Keep it in an input cell so a portfolio-wide sensitivity sweep actually works.
- Where a data point is genuinely missing, market rent growth for a newly acquired asset, for instance, use a conservative benchmark rather than leaving the cell blank, and flag it so a stakeholder reviewing the model knows it's an estimate.
- Reconcile projected figures against actuals every quarter. Practitioner guides recommend the same five components most portfolio models are built around: income, operating expenses, capex, debt service, and net cash flow.
How do you build a scalable Excel portfolio model?
A model that works for two properties and collapses under twenty is a model built without a plan for scale. The fix is a workbook layout that separates raw inputs from calculations from outputs, so growing the portfolio means adding a tab, not rebuilding formulas.
- Start with a master inputs tab. Every assumption that could reasonably change, rent growth, vacancy, expense ratios, interest rates, sits here once, and every other tab references it. This is the single most important habit for auditability: no assumption should ever be typed twice.
- Build one pro-forma tab per property, using REFM's real estate financial modelling templates as a structural reference if you're starting from scratch. Each tab should follow identical row order: income, vacancy, effective gross income, operating expenses, NOI, capex, debt service, net cash flow.
- Add a dedicated debt schedule tab per loan, not buried inside the property tab. This keeps amortisation, interest, and refinancing logic separate from operating assumptions, which matters enormously when a property carries two loans or you're testing a refinance scenario independently of rent growth.
- Create the portfolio roll-up tab. This sums every property tab by category and period. The critical rule: every property tab must use identical timing (monthly, quarterly, or annual) before you sum them, or your roll-up will silently misstate the aggregate.
- Layer a scenario tab on top, using Excel's data tables or Scenario Manager to flex key variables without touching the base case. Microsoft Excel handles this natively through structured tables and named ranges, both of which cut down on the broken-link errors that plague ad hoc spreadsheets.
- Finish with an output dashboard tab that pulls only summary figures, NOI, net cash flow, cash-on-cash, DSCR, for presentation. Never let stakeholders open a working tab directly; a dashboard protects the model from accidental edits.
On cadence: model operations monthly if you have more than four properties or any with seasonal vacancy patterns, quarterly if the portfolio is smaller and stable, and always run the valuation and tax view annually. Monthly granularity catches short-term liquidity gaps that an annual model smooths over and hides.
Circular references are the most common technical failure point, usually caused by debt service depending on a cash sweep that itself depends on debt service. Break the loop by calculating interest on the opening balance only, never the closing balance, and iterate refinancing decisions on a separate pass rather than inside the same formula chain.

Pro Tip: Name every tab consistently, "P1_Pro Forma", "P1_Debt", "P2_Pro Forma", "P2_Debt", so a portfolio of twenty properties stays navigable, and so any formula referencing another tab is self-explanatory when you or a colleague audits it eighteen months later.
How do you calculate consolidated portfolio metrics?
Rolling up individual properties into one portfolio view only works if every input tab shares the same timing and categorisation. Aligning periods, normalising vacancy and expense assumptions to comparable definitions, then summing cash flows by category, is the entire mechanism. Skip the alignment step and your consolidated NOI will be meaningless even if every individual property tab is correct.
The metrics that actually drive decisions are consistent across the industry, though the calculations are worth spelling out:
- Net Operating Income (NOI) equals effective gross income minus operating expenses, before debt service and capex. It's the cleanest comparison point across properties because it strips out financing structure.
- Net cash flow after debt takes NOI, subtracts debt service (interest and principal), and subtracts capex drawn from reserves that period. This is the figure that tells you what actually lands in the bank.
- Cash-on-cash return divides annual net cash flow by total cash invested. It's the metric most relevant to passive income property analysis, since it ignores unrealised appreciation entirely.
- Internal rate of return (IRR) captures the full return profile, operating cash flow plus eventual sale proceeds, discounted to account for timing. It's the right metric for a hold-versus-sell decision but a poor one for judging monthly liquidity.
- Debt service coverage ratio (DSCR) divides NOI by total debt service. Lenders watch this closely, and so should you, because a portfolio can show a healthy consolidated cash-on-cash figure while one asset's DSCR quietly approaches covenant breach territory.
Present per-asset KPIs alongside the consolidated figures, never instead of them. A portfolio-level cash-on-cash of 6 percent can hide one property returning 9 percent and another bleeding cash, and that distinction changes what you do next, refinance the weak asset, sell it, or accept the drag because the strong performer compensates.
Different decisions lean on different metrics: acquisition decisions lean on IRR and cap rate, ongoing hold decisions lean on DSCR and cash-on-cash, and refinance timing leans almost entirely on DSCR trend and the debt schedule's rate reset dates.
How do you stress test a property portfolio model?
A model that only shows the base case tells you what happens if nothing goes wrong, which is the one scenario you least need help planning for. Stress testing is where portfolio cash flow modelling earns its keep, and a workable framework needs at minimum four scenarios and five sensitivity axes.
The standard scenario set:
- Base case, your best estimate of rent growth, vacancy, and rates given current conditions.
- Downside, a moderate shock, vacancy up 2 to 3 points, rent growth flat, one rate reset landing higher than expected.
- Severe downside, a compounding shock, a major tenant vacates, interest rates rise sharply, and a capex item arrives simultaneously.
- Recovery, testing how quickly cash flow normalises after a downside period, useful for judging how long a reserve buffer needs to last.
Sensitivity axes worth sweeping individually before combining them: interest rate movements (test both a 100 and 200 basis point rise), vacancy duration, rent growth assumptions, unplanned capex, and exit capitalisation rate for any property nearing a sale decision. Rate changes flow through a portfolio unevenly, and a property with an interest-only loan resetting in the next twelve months carries far more sensitivity than one on a long fixed term.
A portfolio that survives a single downside scenario but fails a compounding severe downside scenario has a liquidity problem hiding behind an adequate-looking base case.
Deterministic scenarios (the four above, run individually) suit most portfolios of fewer than a dozen properties. Monte Carlo simulation, running thousands of randomised combinations of these variables, earns its complexity only once a portfolio is large enough, or diverse enough across markets, that manual scenario combinations can't capture the correlation risk. Sophisticated investors build these frameworks specifically to confirm the portfolio can meet debt obligations without a forced sale under adverse conditions, not merely to produce an impressive-looking sensitivity table.
The output that matters isn't the scenario itself, it's what you do with it: a severe downside scenario that shows six months of negative consolidated cash flow tells you the size of the liquidity buffer you need, the refinancing window you should lock in now rather than later, and which asset should carry a sell trigger if the downside case starts to materialise.
What are the most common cash flow modelling mistakes?
Most modelling errors aren't conceptual, they're mechanical, and they compound quietly across a portfolio before anyone notices.
- Timing mismatches. Mixing monthly and annual assumptions on the same tab, or summing quarterly cash flows against an annual debt schedule, silently distorts every downstream total. Check that every tab's period convention matches before you build the roll-up.
- Duplicated reserves. Capex reserves get double-counted when a property tab deducts a reserve contribution and the portfolio roll-up separately re-applies a portfolio-wide capex buffer. Decide once where the reserve sits and reference it from a single cell.
- Mis-stated debt flows. Confusing interest-only periods with amortising periods, or forgetting a rate reset date, is the single most common error in multi-property debt schedules. Build the amortisation formula off the loan's actual terms, not a simplified flat-rate assumption.
- Formula drift. A named range or hardcoded assumption that gets overwritten on one tab but not another creates inconsistent portfolios that look reconciled but aren't.
Validation checks worth running on every build:
- Reconcile each period's closing cash balance to the opening balance of the next period, the same discipline Business Victoria's cash flow forecasting guidance recommends for any cash flow forecast.
- Cross-check NOI against a direct capitalisation estimate using current market cap rates.
- Confirm the roll-up total equals the sum of each property tab manually, at least once, before trusting the automated link.
- Compare forecast to actual quarterly, a practice government cash flow guidance treats as a core step rather than an optional extra.
Keep a version history, even a simple dated copy saved before each material change, so you can trace when an assumption shifted and why.
Pro Tip: Before sharing a model with a lender, partner, or co-investor, run every scenario once more from a locked copy. A live model someone else can edit mid-review is how a clean set of numbers turns into a disputed one.
What does a practitioner's portfolio model actually look like?
Before touching a single formula, confirm three things: the current rent roll for every property, the exact terms of every loan (rate, interest-only expiry, LVR covenant), and a five-year capex history. Skipping this step is the single most common reason a model needs to be rebuilt within a month of being finished.
AlphaIQ's approach layers tax-aware and retirement-aware adjustments on top of the operating model rather than folding them into the base case. Depreciation schedules, capital gains treatment on an eventual sale, and how property income interacts with superannuation contribution strategy all sit on a separate adjustment layer, so the operating cash flow view stays clean and the tax view stays auditable.
A compact worked example: two properties, one returning $28,000 in annual net cash flow on a stabilised tenancy, the other returning $14,000 but carrying an interest-only loan resetting to principal-and-interest in eight months. The consolidated base case shows healthy positive cash flow. A single stress test, running that rate reset alongside a 3 percent vacancy uptick on the first property, cuts consolidated net cash flow by more than half, which is precisely the kind of finding a base-case-only model never surfaces.
The properties that look fine individually are rarely the ones that sink a portfolio. It's the correlated shock, one rate reset landing the same year as an unplanned vacancy, that a roll-up model is built to catch.
- Confirm rent roll, loan terms, and capex history before building anything.
- Keep tax and retirement adjustments on a separate layer from operating cash flow.
- Run at least one combined stress scenario, not just isolated sensitivities.
Readers wanting a structured starting point can work through AlphaIQ's guide to modelling property returns alongside the Excel starter layout outlined earlier in this article.
Why most portfolio models fail before the stress test even starts
The conventional advice on this topic focuses almost entirely on formulas, IRR mechanics, cap rate theory, DSCR thresholds, and that's not wrong, but it's not where most portfolios actually fail. They fail on structure. A model with brilliant formulas built on inconsistent timing across five property tabs will produce a confidently wrong answer, and confidently wrong is worse than obviously incomplete.
What gets underestimated is how much of the value in cash flow forecasting real estate comes from the discipline of reconciliation, checking forecast against actual every quarter, not from the sophistication of the scenario engine. A Monte Carlo simulation running on top of bad reserve assumptions just produces a more elaborate wrong answer.
If you take one thing from this, prioritise the roll-up architecture before the scenario layer. Get the per-property structure standardised and reconciled first. The stress testing, the tax overlay, the IRR sensitivity, all of that becomes straightforward once the underlying plumbing is trustworthy. Build the pipes before you turn on the pressure.
Model your own portfolio with AlphaIQ
Building the workbook described above gets you most of the way there, but tax-aware adjustments, depreciation schedules, capital gains treatment, and how property cash flow interacts with your superannuation and retirement plans, are where most spreadsheet models start to strain. Alphaiq brings that layer into one platform, so instead of maintaining a separate tax model alongside your property pro-formas, you see the combined picture: property, investments, super, and retirement income modelled together with the same scenario logic covered in this article.

It suits self-directed investors who already think in cash-on-cash returns and DSCR but want the tax and retirement layer handled without paying for ongoing advice. If you've just built or updated a portfolio roll-up and want to see how it holds up once tax and super are added to the picture, start with AlphaIQ's platform and run your numbers through it directly.
Frequently asked questions
What's the difference between property cash flow analysis and portfolio cash flow modelling?
Property cash flow analysis looks at a single asset's income, expenses, and net return. Portfolio cash flow modelling aggregates multiple properties into one consolidated view, aligning timing and assumptions so you can see combined liquidity, debt coverage, and risk exposure across every asset at once.
Which cash flow projection technique should I use for a small portfolio?
For fewer than a dozen properties, standardised per-property pro-formas rolled into a consolidated tab, tested against four deterministic scenarios (base, downside, severe downside, recovery), covers most decision needs without the complexity of Monte Carlo simulation.
Can a property cash flow calculator replace a full portfolio model?
A standalone calculator is useful for a quick sanity check on a single property's cap rate or cash-on-cash figure, but it can't aggregate multiple assets, model refinancing triggers, or run combined stress scenarios the way a structured Excel workbook can.
How often should I update my real estate financial modeling assumptions?
Reconcile forecast against actual cash flow every quarter at minimum, and revisit rent growth, vacancy, and interest rate assumptions whenever a lease renews, a loan resets, or market conditions shift materially.
Does refinancing always improve portfolio cash flow?
Not necessarily. Refinancing can free up equity or lower a rate, but it can also reset an interest-only period back to principal-and-interest, which increases debt service. Model the refinance scenario explicitly rather than assuming it's automatically a positive.
Sources
Excel remains the practical baseline for building a custom portfolio model, and [REFM's modelling guide](https://mergersandinquisitions.com/real estate-financial-modeling/) offers sample templates and case studies worth studying before you build your first pro-forma from scratch. For a quick sanity check once your model is running, a standalone rental property cash flow and cap rate calculator is a fast way to cross-check a single property's output against your workbook.
For readers wanting a deeper look at comparing outputs across assets, AlphaIQ's guide to comparing property investments and its practical guide to modelling investment scenarios both build directly on the concepts covered here.