
TL;DR:
- Comparing property investments requires analyzing metrics like NOI, cap rate, cash-on-cash return, and DSCR to assess profitability and risk. A thorough market analysis involves recent sales data, careful adjustments for differences, and consideration of rental and property features. Incorporating stress tests, financing scenarios, and utilizing specialized tools ensures more resilient, informed investment decisions.
Comparing property investments means analysing financial and qualitative metrics to determine which asset delivers the best risk-adjusted return for your capital. Most investors focus on purchase price or rental yield alone, which gives an incomplete picture. The metrics that matter most are Net Operating Income (NOI), capitalisation rate (cap rate), cash-on-cash return, and Debt Service Coverage Ratio (DSCR). This article walks you through how to compare property investments using these measures, alongside Comparative Market Analysis (CMA), rental type comparisons, stress testing, and the digital tools that make the process repeatable and reliable.
What are the core financial metrics to compare investment properties?
Property investment analysis starts with four foundational metrics. Each one answers a different question about a deal, and together they give you a complete picture of profitability and risk.
-
Net Operating Income (NOI): NOI equals gross rental income minus all operating expenses, excluding mortgage payments. It tells you how much a property earns from its operations alone. A property with $52,000 in annual rent and $18,000 in expenses has an NOI of $34,000. This figure is the starting point for almost every other calculation.
-
Capitalisation rate (cap rate): Cap rate compares properties regardless of how they are financed by dividing NOI by the purchase price. A property with a $34,000 NOI purchased for $680,000 has a cap rate of 5%. This metric is ideal for an apples-to-apples comparison between two properties in the same suburb, because financing is removed from the equation entirely.
-
Cash-on-cash return: This metric measures the annual pre-tax cash flow against the actual cash you invested, including your deposit and acquisition costs. It reflects the real-world return on your out-of-pocket capital after mortgage repayments. Two properties with identical cap rates can produce very different cash-on-cash returns depending on loan terms and leverage.
-
Debt Service Coverage Ratio (DSCR): DSCR divides NOI by annual debt service (principal and interest). A DSCR above 1.25 means the property generates 25% more income than it needs to cover repayments. High leverage requires careful DSCR monitoring because a financing structure that looks profitable on paper can turn negative when vacancy rises or rates increase.
Pro Tip: Never rely on a single metric to approve or reject a deal. Combining Cash-on-Cash, DSCR, and IRR reveals the full picture of profitability and risk that any one number alone will hide.
Understanding how these metrics interrelate is where the real skill lies. A high cap rate in a regional market may reflect lower demand and higher vacancy risk, not a bargain. A low cash-on-cash return in an inner-city suburb may be acceptable if capital growth is the primary objective.

How to perform a comparative market analysis for investment property
A Comparative Market Analysis (CMA) is the process of identifying recently sold properties similar to your subject property to determine its true market value and rental potential. It is the foundation of sound property value assessment.
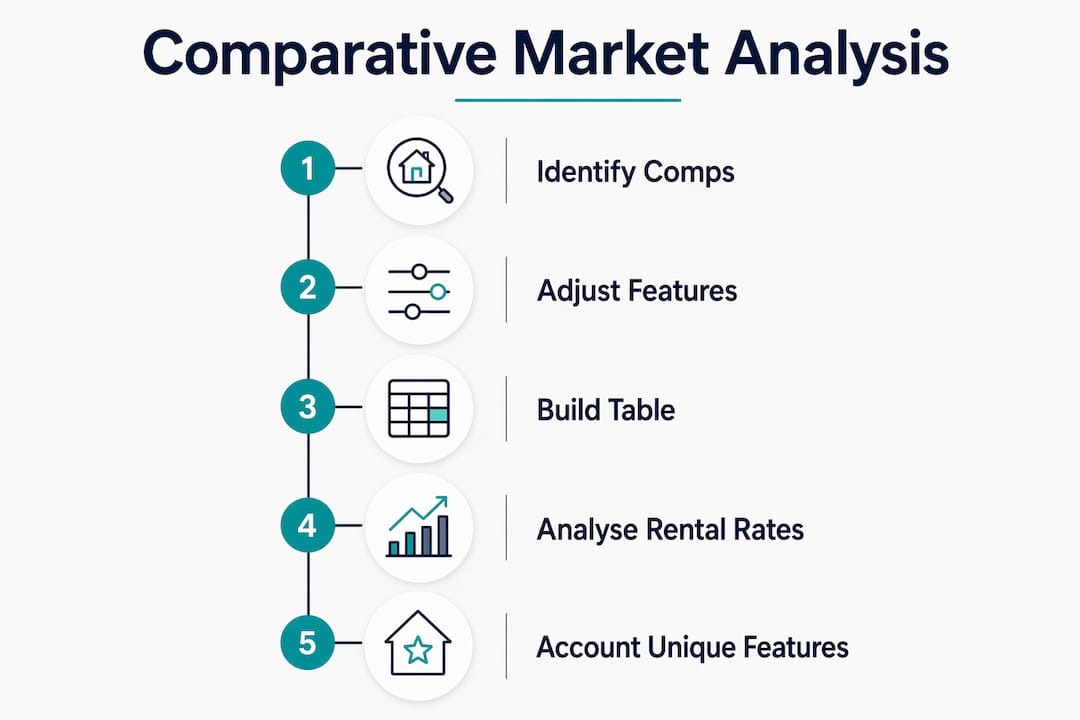
CMA relies on sales data from the last 3 to 6 months with adjustments made for differences in condition, location, and features. Using older data in a rising or falling market produces misleading valuations. In Sydney's inner west, for example, a sale from 18 months ago may understate current values by 10 to 15%.
When selecting comparable properties, match on these criteria:
- Same suburb or immediate surrounding area
- Same property type (house, townhouse, unit)
- Similar land size and floor area (within 10 to 15%)
- Comparable age, condition, and number of bedrooms
- Similar proximity to transport, schools, and amenity
Once you have three to five comps, build a comparison table to make differences visible at a glance.
| Feature | Subject property | Comp 1 | Comp 2 | Comp 3 |
|---|---|---|---|---|
| Sale price | TBD | $820,000 | $795,000 | $840,000 |
| Land size (sqm) | 420 | 400 | 450 | 410 |
| Bedrooms | 3 | 3 | 3 | 4 |
| Condition | Good | Good | Average | Good |
| Adjusted value | TBD | $820,000 | $810,000 | $815,000 |
Adjustments account for differences between the subject property and each comp. If Comp 2 has a larger land size, you subtract value from it to make it comparable. If the subject property has a renovated kitchen that comps lack, you add value. These adjustments require local knowledge and, ideally, recent sales data from CoreLogic or Domain.
Pro Tip: When comparing rental properties, run a separate CMA for rental rates using active listings and recent leasing data. A property's capital value and its rental yield can move in opposite directions, particularly in high-demand suburbs where yields compress as prices rise.
The biggest challenge in a CMA is accounting for unique features that have no direct comparable. A property with a pool, dual occupancy potential, or a north-facing aspect requires qualitative judgement alongside the numbers.
Long-term rentals vs short-term rentals: what the numbers actually show
The choice between a traditional long-term rental and a short-term rental (STR) such as an Airbnb property is not simply a revenue question. It is a fundamentally different business model with different cost structures, risk profiles, and management demands.
On the revenue side, STRs can generate significantly higher gross income in high-demand locations. A two-bedroom apartment in Byron Bay or Melbourne's CBD might earn $80,000 per year on Airbnb versus $36,000 on a 12-month lease. That gap looks compelling until you examine the expense side.
Short-term rentals carry operating expense ratios of 50 to 70%, compared to 30 to 50% for long-term rentals. The difference reflects cleaning fees, platform commissions, furnishing replacement, higher insurance premiums, and active management costs. A $80,000 STR gross income with a 60% expense ratio produces an NOI of $32,000. The $36,000 long-term rental with a 35% expense ratio produces an NOI of $23,400. The STR wins on NOI, but the margin is narrower than the headline revenue suggests.
The other factors to weigh in your investment property comparison include:
- Vacancy and seasonality: STR income is volatile. A coastal property may achieve 90% occupancy in summer and 40% in winter. Long-term rentals provide predictable, contractual income.
- Regulatory risk: Australian councils and state governments are tightening STR regulations. Brisbane, Sydney, and the Gold Coast all have restrictions on nights per year or require registration. A rule change can eliminate your STR income model overnight.
- Management intensity: STRs require active management or a property manager charging 20 to 30% of revenue. Long-term rentals typically cost 7 to 10% in management fees.
- Financing implications: Some lenders apply conservative income assessments to STR properties, which affects your borrowing capacity and DSCR calculations.
When you incorporate these differences into your analysis, the long-term rental often wins on risk-adjusted returns, particularly for investors who prioritise stability and scalability across a portfolio.
How to incorporate financing, risks, and stress tests into your comparison
Financing terms transform a property's theoretical returns into real-world outcomes. Two properties with identical NOI figures can produce dramatically different results depending on your loan structure.
Here is a step-by-step process for stress testing any deal before you commit:
-
Model your base case. Calculate NOI, cash-on-cash return, and DSCR using current market rents, your actual loan terms, and realistic vacancy rates of 4 to 6% for most Australian markets.
-
Apply a financing sensitivity test. A 0.5% interest rate difference can change annual debt service by $1,200 or more on a $500,000 loan. Model your DSCR at your current rate, at current rate plus 1%, and at current rate plus 2%. If the deal breaks at a 1% rate rise, it carries meaningful financing risk. Reviewing how RBA rate changes affect returns is a practical step every Australian investor should take before signing a contract.
-
Stress test rental income. Conservative underwriting models rents 15 to 20% below market and applies higher vacancy rates to test deal viability under pessimistic conditions. If a property only works at full market rent with zero vacancy, it is not a resilient investment.
-
Account for capital expenditure (CapEx). Budget 1 to 2% of property value annually for maintenance, repairs, and replacements. Investors who ignore CapEx consistently overstate their cash-on-cash returns. A roof replacement or hot water system failure can wipe out two years of positive cash flow.
-
Model a pessimistic hold period. Project your returns over five and ten years using conservative capital growth assumptions of 3 to 4% annually rather than the 7 to 8% figures that optimistic forecasts often use.
Pro Tip: If a deal only works in the best-case scenario, walk away. The deals worth holding are the ones that remain viable under your worst-case assumptions. Experienced investors model pessimistic scenarios precisely to avoid overpaying in competitive markets.
The most common mistake in property investment analysis is treating the base case as the likely case. Markets shift, tenants vacate, and interest rates move. Your comparison framework should reward resilience, not optimism.
What tools and workflows can simplify property investment comparison?
Repeatable, accurate investment property comparison requires the right tools and a disciplined workflow. Manual spreadsheets work, but they are slow and prone to error. A structured toolkit reduces both.
- AI-powered deal analysers: AI tools automate comps, rehab estimates, and ROI projections, enabling faster and more accurate investment decisions. Platforms like FlipMantis integrate deal analysis into CRM workflows, offering Maximum Allowable Offer (MAO) calculations and scenario modelling.
- NOI and cap rate calculators: Online calculators from platforms such as Alphaiq allow you to input income and expense assumptions and instantly compare multiple properties side by side.
- Spreadsheet models: A well-built Excel or Google Sheets model that projects NOI, cash flow, DSCR, and equity growth over a 10-year hold period remains one of the most flexible tools available. Build in scenario tabs for base, optimistic, and pessimistic cases.
- CMA data sources: CoreLogic, Domain, and REA Group all provide recent sales and rental data for Australian markets. Paid subscriptions to CoreLogic's RP Data platform give access to granular suburb-level analytics.
- Portfolio modelling platforms: For Australian investors managing multiple properties alongside superannuation and other assets, modelling property investment decisions within a broader wealth context produces better outcomes than analysing each deal in isolation.
The workflow that works best combines automated data gathering with human judgement on adjustments and assumptions. Use tools to gather and calculate. Use your analysis to interpret and decide.
Key takeaways
Effective property investment comparison requires combining multiple financial metrics, realistic stress testing, and market-adjusted data rather than relying on any single number or headline yield figure.
| Point | Details |
|---|---|
| Use multiple metrics | NOI, cap rate, cash-on-cash return, and DSCR together reveal true deal quality. |
| Run a proper CMA | Use sales data from the last 3 to 6 months and adjust for property differences. |
| Stress test every deal | Model rents 15 to 20% below market and test DSCR at higher interest rates. |
| Understand rental type differences | STR expense ratios of 50 to 70% significantly reduce the income advantage over long-term rentals. |
| Use the right tools | AI analysers, spreadsheet models, and portfolio platforms improve accuracy and repeatability. |
Why I think most investors compare properties the wrong way
Most investors I speak with compare properties by yield and price. They find a property with a 5.5% gross yield, compare it to one at 4.8%, and assume the first is the better deal. That approach misses almost everything that matters.
The properties worth owning long term are rarely the ones with the highest headline yield. Successful investors focus on capital growth over cash flow for long-term wealth, favouring well-located quality properties. A 4.5% yield in a suburb with strong population growth, limited supply, and excellent infrastructure spending will outperform a 6% yield in a stagnant regional market over a 10-year hold.
What I have found consistently is that the investors who build real wealth apply what I call the "forever test." They ask: would I be comfortable holding this property for 20 years if I had to? That focus on quality locations and demand drivers over trendy markets separates the investors who build portfolios from those who accumulate problems.
The other mistake I see regularly is ignoring how financing interacts with returns. A deal that looks solid at 6.5% interest can become a cash flow drain at 7.5%. Investment strategies must align with risk tolerance and investment horizon, and that alignment has to be stress tested against realistic rate scenarios, not just current conditions.
My practical advice: build your comparison framework before you look at properties, not after. Decide what metrics matter to you, what your minimum DSCR threshold is, and what stress test assumptions you will apply. Then run every property through the same filter. Consistency beats intuition every time.
— Jonathan
Make smarter property decisions with Alphaiq
Alphaiq is built for Australian investors who want to compare and model property investments with real numbers, not guesswork.

The Alphaiq AI Wealth Intelligence Platform combines tax-aware financial modelling with scenario simulation, so you can stress test deals, project capital growth, and see how a new property fits alongside your superannuation and existing assets. You can model the impact of RBA rate changes, compare rental scenarios, and run pessimistic and optimistic projections side by side. For investors planning their retirement alongside property accumulation, the superannuation projection calculator adds another layer of clarity to your overall wealth position. Take control of your next property decision with Alphaiq.
FAQ
What is the best metric for comparing investment properties?
No single metric is sufficient. Combining cap rate for unlevered comparison, cash-on-cash return for financing impact, and DSCR for debt risk gives the most complete picture of a deal's quality.
How do I calculate cap rate on an investment property?
Cap rate equals NOI divided by the purchase price, expressed as a percentage. A property with a $34,000 NOI purchased for $680,000 has a cap rate of 5%.
How does a CMA differ from a property valuation?
A CMA uses recent comparable sales to estimate market value and is typically prepared by a buyer's agent or investor. A formal valuation is conducted by a licensed valuer and is required by lenders for mortgage purposes.
What vacancy rate should I use when stress testing a rental property?
Conservative underwriting applies vacancy rates of 8 to 10% rather than the 2 to 4% that optimistic projections often assume. This tests whether the deal remains viable during periods of tenant turnover or market softness.
How do short-term rental returns compare to long-term rentals in Australia?
STRs can generate higher gross income but carry operating expense ratios of 50 to 70%, compared to 30 to 50% for long-term rentals. After expenses, the net income advantage is often smaller than the headline revenue figures suggest, and regulatory and vacancy risks are significantly higher.