
TL;DR:
- Portfolio optimisation aligns investments with goals, risk, and time horizon for better performance.
- Scenario simulation tests portfolio resilience against market shocks, aiding better decision-making.
- Regular review and human judgment complement models, ensuring lasting portfolio success.
You put in the effort: you research assets, track market news, and rebalance occasionally. Yet your portfolio still underperforms your expectations. For many self-directed Australian investors, the missing piece is not more information but a structured, repeatable approach to financial modelling and scenario simulation. This guide walks you through proven optimisation methodologies, practical preparation steps, and hands-on scenario techniques tailored specifically for Australians managing their own wealth. By the end, you will have a clear framework for stress-testing your portfolio and making decisions backed by real numbers rather than gut instinct.
Table of Contents
- What does portfolio optimisation really mean?
- Preparation: Data, tools and market context
- Step-by-step: Modelling and scenario simulation
- Common mistakes and advanced tweaks
- Measuring results and recalibrating your strategy
- Why only models fail: A human-centric approach to portfolio optimisation
- Take portfolio optimisation further with AlphaIQ
- Frequently asked questions
Key Takeaways
| Point | Details |
|---|---|
| Diversification is key | A well-optimised portfolio balances growth with defensive assets to manage risk across market cycles. |
| Models guide, but don’t decide | Financial modelling like Monte Carlo or MPT supports better outcomes but doesn’t replace personal judgement and scenario simulation. |
| Ongoing review matters | Regularly recalibrating your strategy ensures your portfolio keeps pace with market and life changes. |
| Avoid common traps | Beware pitfalls like home bias, over-diversification or ignoring tax when tweaking your strategy. |
What does portfolio optimisation really mean?
Portfolio optimisation is the process of arranging your investments to achieve the best possible return for a given level of risk, or alternatively, the lowest possible risk for a target return. It is not about chasing the hottest stocks. It is about deliberately constructing and maintaining a portfolio that aligns with your financial goals, life stage, and risk tolerance.
For Australian investors, success looks different depending on where you are in your wealth journey. A 45-year-old accumulating assets has different objectives than a 62-year-old planning drawdowns from super. Understanding investment returns in the context of your own timeline is where optimisation begins.
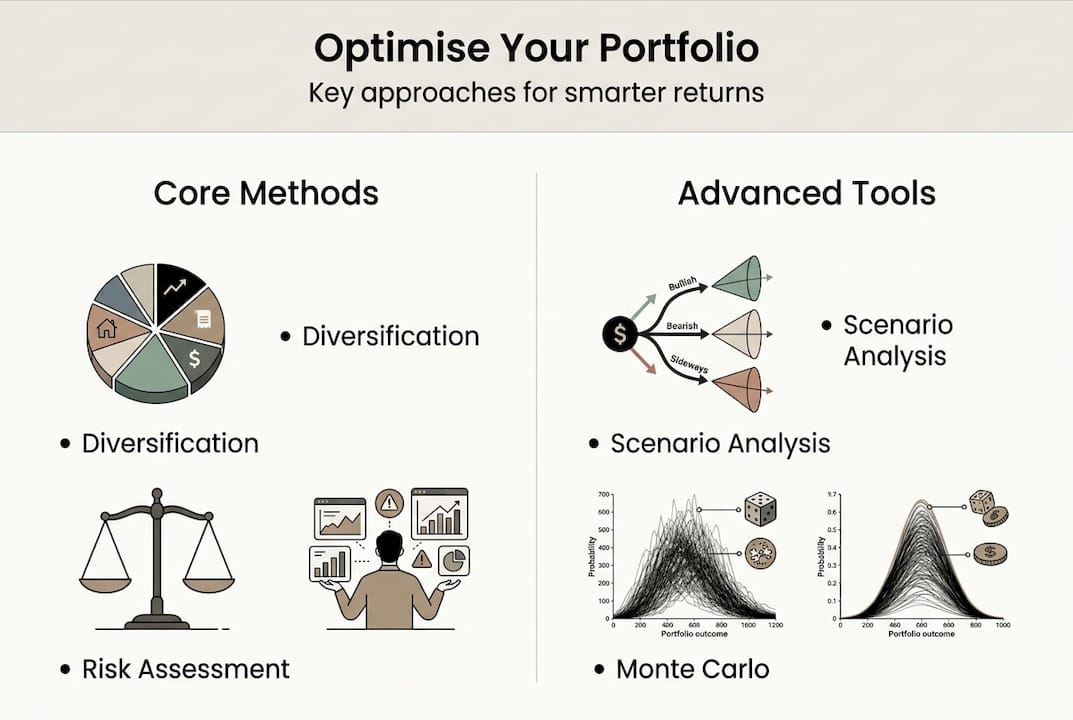
Several core frameworks guide the process. Core methodologies include Modern Portfolio Theory (MPT) with mean-variance optimisation (MVO), the Black-Litterman model, Monte Carlo simulations, Risk Parity, and scenario analysis with stress testing.
| Framework | Core feature | Best suited for |
|---|---|---|
| MPT / MVO | Balances risk and return using historical data | Broad diversification planning |
| Black-Litterman | Incorporates investor views into allocations | Customised, conviction-based portfolios |
| Monte Carlo simulation | Models thousands of random future scenarios | Retirement income and drawdown planning |
| Risk Parity | Allocates based on risk contribution, not capital | Volatile or uncertain market environments |
| Scenario analysis | Tests specific market shocks or policy changes | Stress testing and contingency planning |
Why does optimisation matter right now? Several forces make it essential:
- Market volatility from rising interest rates and geopolitical uncertainty compresses margins for error.
- Regulatory change, including super contribution cap adjustments, shifts the planning landscape regularly.
- Retirement timelines for Australians aged 45 to 65 are shortening, reducing the window to recover from poor allocation decisions.
- Tax complexity, particularly around franking credits and capital gains, creates hidden drag that only structured modelling can quantify.
Scenario simulation strengthens traditional approaches by testing your plan against reality, not just historical averages.
Preparation: Data, tools and market context
Before you build a single model, you need the right inputs. Garbage in means garbage out. Collecting accurate, current data is the unglamorous but essential first step.
Here is the core data you need to gather before modelling:
| Data type | What to record | Why it matters |
|---|---|---|
| Asset breakdown | All holdings by class (equities, property, cash, bonds, super) | Reveals true diversification and concentration |
| Risk tolerance | Low, medium, or high, matched to emotional and financial capacity | Drives allocation boundaries |
| Investment goal | Growth, income, capital preservation, or blended | Shapes the optimisation objective |
| Time horizon | Years to target event (retirement, drawdown, major purchase) | Affects acceptable volatility range |
| Tax position | Marginal rate, CGT exposure, franking credit balance | Critical for after-tax return calculations |
For benchmarking, context is everything. Australian super funds allocate roughly 50% to international assets, including 31% in listed equities. Comparing your personal portfolio against these allocations gives you a useful starting point, especially if your super and direct investments overlap significantly.
If you are assessing 60/40 portfolio benchmarks, recent research suggests their suitability varies considerably depending on your retirement year and sequence-of-returns risk. That benchmark is worth stress testing, not accepting at face value.
Reliable data sources for Australian investors include:
- ASX for listed equity prices, dividend yields, and ASX dividend metrics
- Morningstar for fund performance and asset class return data
- APRA for superannuation fund performance benchmarks and industry statistics
- ATO for current tax rates, super contribution caps, and franking credit rules
For modelling tools, Monte Carlo simulators and scenario analysis platforms are increasingly accessible to self-directed investors. If you are also tracking your retirement super balance, integrating super projections into your model is essential.

Pro Tip: Record every data source and assumption in a simple spreadsheet before you start. When markets shift or rules change, you can update inputs quickly without rebuilding your model from scratch.
Step-by-step: Modelling and scenario simulation
Scenario simulation answers the 'what if' questions that traditional planning ignores. What if inflation stays elevated for five years? What if equities drop 30% in your first year of retirement? What if super rules change and your concessional cap reduces? Monte Carlo tools test outcomes under thousands of varying market conditions, giving you probability-weighted results rather than single-point forecasts.
Here is a practical step-by-step process for setting up your first scenario:
- Define your base case. Record your current portfolio allocations, expected annual contributions, target retirement age, and desired income in retirement.
- Identify your key variables. These typically include equity return, inflation rate, interest rate, and super contribution level.
- Set scenario parameters. Create at least three scenarios: base case (long-run averages), pessimistic (market crash, high inflation), and optimistic (above-average growth, low inflation).
- Run the simulation. Use your chosen tool to model outcomes across each scenario, noting the probability of meeting your income target in retirement.
- Analyse the gaps. Where does the pessimistic scenario fall short? That gap is your planning risk and the area that needs attention first.
- Adjust and rerun. Test allocation changes, additional contributions, or drawdown rate adjustments to close identified gaps.
For context, consider a 55-year-old with $600,000 in super, $200,000 in ASX equities, and a target retirement age of 65 on $70,000 per year. A base-case simulation might show 87% probability of sustaining that income to age 90. A stress test with a 30% equity drawdown in year one of retirement could drop that to 61%. That 26-percentage-point gap tells you exactly where to focus: sequence-of-returns risk, which you can address with a defensive allocation buffer or phased drawdown strategy.
| Method | Scenario simulation strength | Limitation |
|---|---|---|
| MPT | Efficient frontier analysis | Assumes static correlations |
| Black-Litterman | Incorporates your market views | Requires clear conviction inputs |
| Monte Carlo | Models path-dependent risk | Results depend on assumption quality |
| Stress testing | Tests extreme but plausible events | Scenarios must be manually defined |
For broader insights on portfolio concentration risk and how to identify it in your own holdings, that is worth exploring before you finalise your scenario assumptions. You can also find additional wealth intelligence insights across asset classes and super strategies.
Pro Tip: Always update your scenario assumptions after major real-world shocks like a rate cycle shift or a super policy change. Relying on pre-2022 historical averages for inflation assumptions, for example, would significantly underestimate current risk.
Common mistakes and advanced tweaks
Even experienced investors fall into predictable traps when optimising their portfolios. Recognising them early saves you from compounding errors over time.
The most common mistakes include:
- Home bias. Australian investors frequently hold 60 to 70% of their equities in ASX-listed stocks, creating concentration risk in a market that represents roughly 2% of global equity capitalisation.
- Ignoring taxes. Over-diversification and ignoring taxes are consistently identified as portfolio killers. Tax drag is invisible in pre-tax return figures but devastating to actual wealth outcomes.
- Over-diversifying. Adding more funds or ETFs does not always reduce risk. If they are correlated, you get complexity without genuine diversification benefit.
- Anchoring to historic returns. Past performance shapes our intuitions but not future outcomes. Tax-aware portfolio tweaks that account for current CGT and franking credit positions often deliver more reliable gains.
'Ignoring taxes can easily erase 1 to 2% in annual returns over a decade.'
Advanced tactics to elevate your results:
- Valuation tilts. Overweight asset classes trading below long-run fair value based on cyclically adjusted price-to-earnings ratios or dividend yield spreads.
- Dynamic risk constraints. Reduce equity exposure systematically as volatility rises above a defined threshold, rather than waiting for a large drawdown to prompt action.
- CVaR (Conditional Value at Risk). Go beyond standard deviation by measuring expected loss in the worst-case tail scenarios, which is especially important near retirement.
- Franking credit optimisation. Favour fully franked dividend stocks within your taxable account and assess how credits interact with your marginal rate to maximise after-tax yield.
For investors approaching retirement, avoiding concentration risk in a handful of high-conviction positions becomes increasingly important as recovery time shortens.
Pro Tip: Revisit your risk profile at least once per year and immediately after any major life change, such as a job shift, inheritance, or approaching preservation age. Your capacity for risk changes faster than most investors expect.
Measuring results and recalibrating your strategy
Optimisation is not a one-off exercise. Portfolios drift as markets move, and your personal circumstances evolve. Regular measurement and recalibration are what separate investors who maintain strong risk-adjusted returns from those who set and forget.
The key performance indicators to track are:
- Risk-adjusted return (Sharpe ratio). Measures how much return you earn per unit of risk taken. A rising Sharpe ratio means your portfolio is becoming more efficient.
- Maximum drawdown. The largest peak-to-trough loss in a given period. This is a practical measure of how much pain your portfolio would have inflicted during a crisis.
- Portfolio volatility. Annualised standard deviation of returns. Compare this against your stated risk tolerance to check alignment.
- Income yield. Particularly relevant for investors approaching or in retirement, where cash flow reliability matters as much as total return.
PIMCO research and the Monash Future of 60/40 study suggest that targeted allocation tweaks, such as a stock-bond shift or currency optimisation, can add 1 to 2% per annum in risk-adjusted returns. Over a 15 to 20 year retirement horizon, that compounding difference is substantial.
A practical review checklist:
- Review quarterly: check KPIs against targets and benchmark indices.
- Review after major market events: run a fresh stress test if volatility spikes or a sector corrects sharply.
- Review after life changes: adjust time horizon, risk profile, and income target whenever your circumstances shift.
- Review after regulatory changes: update super contribution assumptions, tax rates, and pension rules as legislation evolves.
Personal wealth tracking platforms can automate alert triggers, flag drift from target allocations, and surface scenario updates without requiring you to manually rebuild models each quarter. Automation here is not laziness; it is discipline at scale.
Why only models fail: A human-centric approach to portfolio optimisation
Here is the uncomfortable truth: the models are not enough on their own. MPT assumes rational investors and stable correlations. Monte Carlo simulations assume your inputs are accurate. Neither accounts for the investor sitting behind the screen.
Real people do not behave like spreadsheets. They sell equities in a panic at the bottom of a cycle. They concentrate in familiar names because unfamiliar ones feel risky. They delay rebalancing because selling a winner feels wrong. None of these behaviours show up in a Black-Litterman output.
The best investors use models as scaffolding, not as final answers. They run scenarios to reveal the shape of the problem, then apply judgement rooted in their own values, goals, and honest self-awareness about their biases. Scenario simulation is genuinely powerful precisely because it forces you to confront gaps that look invisible when markets are calm.
Regular reflection, not quarterly mechanical box-ticking, is where real alpha lives. Asking 'has my goal changed?' or 'am I still comfortable with this level of drawdown?' is as valuable as any algorithm. For investors weighing structural decisions like SMSF vs industry super, that human judgement layer is especially critical. The model tells you the numbers; your values tell you what the numbers are for.
Take portfolio optimisation further with AlphaIQ
The strategies in this guide are powerful, but applying them manually is time-consuming. AlphaIQ brings it all together in one place.

The AlphaIQ platform automates scenario modelling and risk evaluation across your investments, super, property, and retirement income. You can run stress tests, project super balances with the retirement projection calculator, and model debt recycling strategies with the debt recycling tool. Every calculation is tax-aware and benchmarked against real Australian market data. Whether you are stress-testing a drawdown scenario or optimising franking credit yield, AlphaIQ gives you the clarity to act with confidence, without the cost of ongoing advice.
Frequently asked questions
Which is better for optimisation: MPT, Black-Litterman, or Monte Carlo simulation?
Each serves a different purpose: MPT provides a foundational risk-return framework, Black-Litterman allows you to blend your own market views with market equilibrium, while Monte Carlo simulations model uncertainty through thousands of potential future paths, making it particularly valuable for retirement income planning.
How often should I optimise my investment portfolio?
Review your portfolio at least quarterly and after major market events or life changes, as ongoing recalibration ensures your strategy stays aligned with evolving goals and market conditions.
Can scenario analysis protect my retirement portfolio?
Yes. Scenario analysis stress tests your portfolio against market shocks and drawdown sequences, and Monte Carlo tools give you probability-weighted outcomes that reveal whether your retirement income plan is genuinely resilient or just historically lucky.
What is the typical international asset allocation for Australian super funds?
Australian super funds allocate roughly 50% to international assets, with approximately 31% in listed equities, making them a useful benchmark when assessing your own portfolio's global exposure.