
To project your superannuation growth, combine your current balance, future contributions (including the Superannuation Guarantee), an assumed net investment return, and subtract fees and tax across your chosen time horizon, then run best, base, and worst-case scenarios using an authorised calculator or spreadsheet.
Every reliable projection starts with these inputs:
- Age and retirement age — sets your compounding horizon
- Current super balance — your starting point
- Salary and contribution rate — employer SG plus any salary sacrifice or voluntary amounts
- Investment return assumption — nominal or real, matched to your asset allocation
- Fees and insurance premiums — both fixed dollar amounts and percentage-based charges
- Inflation rate — to convert nominal figures into today's purchasing power
- Tax treatment — concessional contributions taxed at 15%, earnings in accumulation phase taxed at 15%
The MoneySmart superannuation calculator is a good starting point for most Australians. For tax-aware scenario modelling with editable assumptions, the Alphaiq Super Calculator is purpose-built for self-directed investors aged 35–65.
Table of Contents
- What inputs does every super projection require?
- How do you run a super projection step by step?
- What modelling assumptions do Australian calculators use?
- How do you project sustainable retirement income from your super?
- What steps actually increase your projected super balance?
- How should you read and act on projection outputs?
- How does the Alphaiq Super Calculator help you project and optimise your super?
- Key takeaways
- Realistic planning matters more than optimistic projections
- The Alphaiq Super Calculator: built for Australians who want real numbers
- Authoritative sources and further reading
What inputs does every super projection require?
Your projection is only as accurate as the numbers you feed it. Getting these right matters far more than choosing between calculators.

Age, balance, and salary determine how long compounding has to work and how much flows in each year. A 45-year-old with $180,000 and 20 years to retirement has a very different projection profile than a 55-year-old with the same balance and 10 years remaining.
Contributions are the lever you control most directly. The Superannuation Guarantee (SG) rate is legislated to gradually increase to its full expected level of ordinary time earnings, and that trajectory is already baked into most Australian calculators. On top of that, salary sacrifice contributions (concessional) are subject to annual caps on concessional and non-concessional contributions as set by current regulations. Unused concessional cap amounts can be carried forward if your total super balance is below $500,000, which is worth modelling explicitly if you have had career gaps.
Return assumptions are where projections diverge most. Treasury's MARIA model uses 7.5% for accumulation phase and 6.5% for retirement phase, before fees. The MoneySmart calculator uses default return ranges of roughly 3.7–7.0% depending on asset mix. Use your fund's actual historical net return as a cross-check, but do not assume it will repeat.
Statistic callout: Treasury's MARIA model fees formula uses $74 (indexed) plus 0.85% of balance annually. On a $50,000 balance, that fixed $74 represents a proportionally larger drag than on a $500,000 balance, which is why fixed fees erode low balances disproportionately.
Pro Tip: Replace every default fee figure in a calculator with your fund's actual annual fee from your most recent member statement. A 0.3% difference in fees compounds to a meaningful gap over 20 years.
How do you run a super projection step by step?
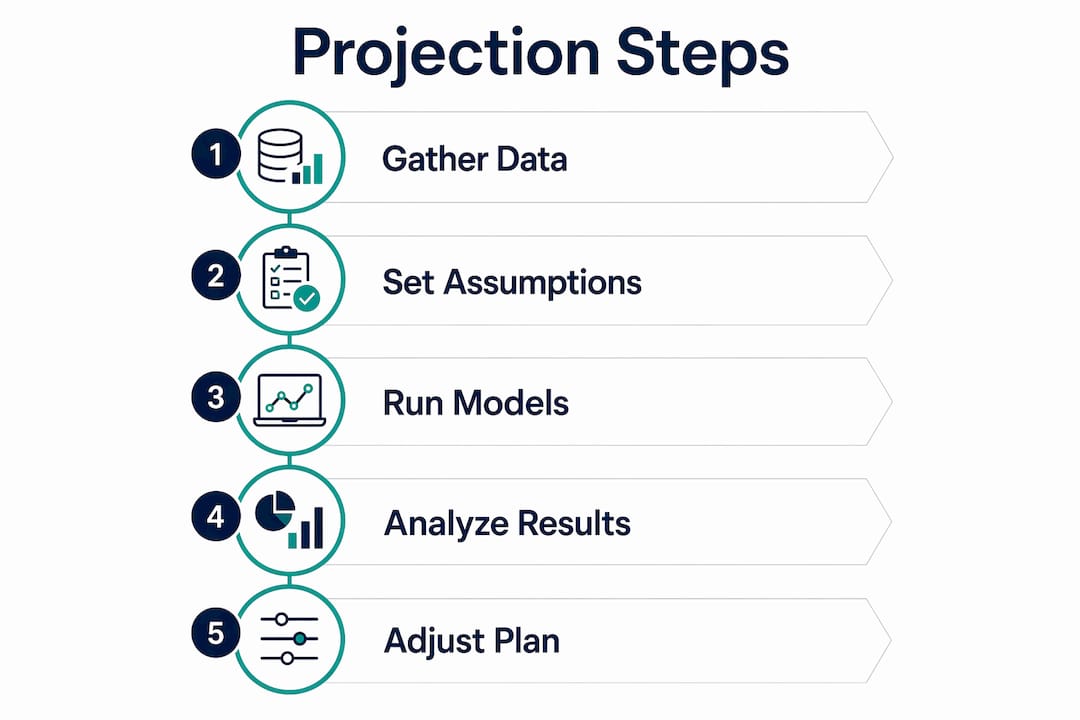
A structured workflow produces projections you can trust and revisit.
- Set your base-case inputs. Enter your current age, balance, salary, SG rate (12%), any salary sacrifice, your fund's actual fee, and a mid-range return assumption (around 6.5–7.0% nominal for a balanced fund).
- Run the base case. Record the projected balance at your planned retirement age. This is your reference point.
- Run a worst case. Drop the return assumption by 1.5–2 percentage points and increase fees by 0.3%. This tests the floor of realistic outcomes.
- Run a best case. Increase the return by 1.5 percentage points and model a modest salary sacrifice addition. This shows the ceiling if conditions are favourable.
- Run sensitivity tests. Change one variable at a time: a $50 per week increase in contributions, a 1% higher return, retiring two years later, or consolidating a second account. Record the impact on the final balance for each change.
- Document your assumptions. Save the inputs alongside the output. When you re-run projections next year, you need to know what changed and why.
Worked example: A 45-year-old earning $95,000 with a $150,000 balance, 12% SG, no salary sacrifice, a 6.5% net return, and $800 in annual fees projects to approximately $620,000 at age 65. Increasing salary sacrifice contributions materially increases projected balance, while a one percent lower return assumption significantly reduces it over the same period.
Deterministic models (fixed return each year) are sufficient for personal planning and quick scenario checks. Stochastic models (random return sequences) are more useful for understanding sequencing risk near retirement, but they require specialist tools and are less intuitive to interpret.
What modelling assumptions do Australian calculators use?
The assumptions underlying a projection matter as much as the tool itself.
- Return assumptions: Conservative allocations typically use low single-digit nominal returns; balanced funds mid single digits; growth-oriented allocations higher single digits. Treasury's MARIA baseline reflects a diversified portfolio with significant equity exposure.
- Fees: Modelled as a fixed annual dollar amount plus a percentage of balance. Always override defaults with your fund's actual figures.
- Compounding frequency: Most Australian calculators compound annually. Monthly compounding produces slightly higher outcomes; the difference over 20 years is modest but worth noting if you are comparing tools.
- Inflation: A 2.5% inflation assumption converts nominal balances to today's dollars. Always check whether a calculator is showing real or nominal figures before comparing outputs.
- Franking credits: Concessional tax treatment and franking credits on Australian equity dividends can add 0.3–0.5% to effective net returns for funds with significant domestic equity exposure. Not all calculators model this explicitly.
- SG trajectory: Any projection that does not include the full SG path to 12% will understate contributions for members still in accumulation.
Pro Tip: Always declare whether your projection uses real or nominal returns. Mixing the two in a single model is one of the most common errors in DIY super spreadsheets.
Asset allocation is the single biggest driver of long-run return assumptions. Choosing a growth allocation over a conservative one can add hundreds of thousands of dollars to a projected balance over 20 years, but it also increases the range of outcomes, particularly in the decade before retirement.
How do you project sustainable retirement income from your super?
Reaching a target balance is only half the problem. The harder question is how long it lasts.
At retirement, your projection assumptions need to shift. Expected returns drop (Treasury's MARIA uses 6.5% in retirement phase versus 7.5% in accumulation), and capital preservation becomes more important than growth. Sequencing risk, the danger of poor returns in the first few years of drawdown, can permanently reduce income capacity even if long-run averages recover.
A commonly cited rule of thumb is a 4% annual drawdown rate, though Australian conditions (Age Pension interactions, tax-free earnings in pension phase, and longevity) mean this needs to be tested against your specific balance and income needs. The ASFA Retirement Standard estimates comfortable retirement spending at around $72,663 per year for a couple and $51,630 for a single (as at the most recent ASFA update), both assuming home ownership.
Earnings within a pension-phase account are tax-free up to the transfer balance cap, which is a material advantage that tax-aware modelling should capture explicitly. Age Pension eligibility can supplement drawdown for those with lower balances, reducing the required drawdown rate.
For example, a 65-year-old retiring with a $500,000 balance and drawing down 4% annually, with a 5% net return in pension phase and no additional contributions, can expect their balance to last beyond 10 years, but longevity and market returns will determine the exact trajectory. This is for illustration only; individual outcomes will vary.
For a structured approach to planning retirement income, model at least three drawdown scenarios before you retire, not after.
What steps actually increase your projected super balance?
The highest-impact actions are straightforward, but their compounding effect is easy to underestimate.
- Salary sacrifice: Even modest pre-tax contributions compound significantly over time. An extra $100 per week from age 45 adds meaningfully to a projected balance at 65, particularly given the 15% concessional tax rate versus your marginal rate.
- Consolidate accounts: Fixed fees on multiple accounts erode low balances faster than most members realise. Consolidating to one fund eliminates duplicate fixed fees and insurance premiums immediately.
- Review investment allocation: ASFA data shows system assets reached $2.7 trillion at end September 2024, with average annual growth of approximately 8.2% over the prior decade. Members in conservative allocations during that period captured significantly less of that growth.
- Defer retirement where feasible: Two additional working years adds contributions and removes two years of drawdown, a double benefit that projections often understate.
- Use catch-up contributions: If your total super balance is below $500,000, unused concessional cap amounts from the prior five years can be contributed in a single year, subject to ATO rules.
Statistic callout: Treasury research confirms that fixed account management fees and insurance premiums have a proportionally greater impact on low-balance accounts. Consolidating multiple accounts early prevents fee erosion that compounds across decades.
One caution: chasing higher returns by shifting to an aggressive allocation late in your career increases sequencing risk. A sharp market fall in the five years before retirement can permanently reduce your balance in a way that a 30-year-old's portfolio can recover from. Match your allocation to your time horizon, not your desired outcome.
For more superannuation tips tailored to 2026 conditions, the Alphaiq blog covers contribution strategies in detail.
How should you read and act on projection outputs?
A projection is a scenario, not a forecast. Treat the output as a range of plausible outcomes, not a number to bank on.
- Focus on the spread between best and worst cases, not the base-case point estimate. A wide spread tells you your outcome is sensitive to assumptions; a narrow spread gives you more confidence.
- A ±1% shift in the return assumption over 20 years can change a projected balance by 20–30%. That is the most powerful single variable in most projections.
- Policy risk is real. The RBA and Treasury both note that contribution rules, withdrawal schemes, and tax concessions have changed repeatedly since 1992. Always run a scenario that assumes a modest reduction in tax concessions or a contribution cap change.
- Prioritise fee reduction and contribution increases over return optimisation. Fees are certain; returns are not.
Pro Tip: Save a dated copy of your projection inputs and outputs each year. When you re-run the model, comparing last year's assumptions to this year's actuals tells you exactly where your plan is tracking and where it is drifting.
How does the Alphaiq Super Calculator help you project and optimise your super?
The Alphaiq Super Calculator is designed specifically for Australians who want more than a single-number estimate. It provides tax-aware modelling, scenario simulation, and sensitivity testing built around Australian rules, including the SG trajectory, concessional and non-concessional caps, franking credit treatment, and pension-phase tax settings.
Core features include:
- Editable assumptions for return rates, fees, insurance premiums, and inflation, so you replace defaults with your fund's actual figures
- Scenario simulation across best, base, and worst cases in a single view
- Drawdown modelling that shifts assumptions at retirement and accounts for pension-phase tax treatment
- SG path simulation that models the full contribution trajectory through to 12%
- Sensitivity testing that shows the dollar impact of changing one variable at a time
"The practical challenge is not accumulating a large balance — it is converting that balance into reliable retirement income. Modelling the drawdown phase with the same rigour as the accumulation phase is what separates a useful projection from a number that looks good on paper." — Deloitte, Dynamics of the Australian Superannuation System
Alphaiq is one option alongside public calculators such as MoneySmart. For self-directed investors who want detailed, shareable projections with explicit tax and fee modelling, it offers a level of granularity that general-purpose tools do not.
Key takeaways
Accurate super projections require the right inputs, realistic assumptions, and regular scenario testing, not just a single number from a default calculator.
| Point | Details |
|---|---|
| Set real inputs, not defaults | Replace calculator defaults with your fund's actual fees, insurance premiums, and return history for accuracy. |
| Run three scenarios minimum | Base, best, and worst cases reveal the range of outcomes and show which inputs matter most. |
| Consolidate accounts early | Fixed fees on multiple accounts erode low balances disproportionately; consolidating removes duplicate costs immediately. |
| Return assumptions dominate | A ±1% shift in the return assumption over 20 years can move a projected balance by 20–30%. |
| Use Alphaiq for tax-aware modelling | The Alphaiq Super Calculator provides scenario simulation, drawdown modelling, and franking credit treatment in one place. |
Realistic planning matters more than optimistic projections
Most people running super projections for the first time make the same mistake: they use the best-case return assumption and the lowest plausible fee, then wonder why the number feels too good to be true. The honest answer is that it usually is.
For Australians in the 35–50 age band, projections are most useful as contribution targets. If your base-case projection falls short of your retirement income goal, the gap tells you exactly how much more you need to contribute or how many more years you need to work. That is a useful number. For those aged 50–65, the priority shifts to testing drawdown sustainability. A balance that looks comfortable at 65 can be depleted faster than expected if returns disappoint in the first five years of retirement, a risk that sequencing-aware modelling captures and a single-number projection does not.
The tools are good. The assumptions you feed them matter more. Use conservative return assumptions, model your actual fees, and run the worst case before you rely on the base case. And for decisions involving significant tax implications, such as large catch-up contributions or transitioning to pension phase, combine tool outputs with advice from a qualified financial adviser or tax professional.
The Alphaiq Super Calculator: built for Australians who want real numbers
For self-directed Australians aged 35–65 who want detailed, tax-aware super projections without ongoing advice fees, the Alphaiq Super Calculator gives you scenario simulation, drawdown modelling, and sensitivity testing in one place.

You can edit every assumption, model the full SG trajectory, and see how small changes to contributions or fees shift your projected balance at retirement. Your data is handled in accordance with Alphaiq's privacy policy, and projections are shareable so you can revisit them annually or after major life events.
Run your projection now and see where your super is actually headed.
Authoritative sources and further reading
These are the primary sources underpinning the modelling assumptions, policy context, and industry data in this guide.
- MoneySmart superannuation calculator — use for quick authorised projections and to cross-check your inputs against ASIC-approved defaults.
- Treasury MARIA model — The superannuation system in aggregate — the authoritative source for long-run return and fee assumptions used in Australian modelling (7.5% accumulation, 6.5% retirement phase).
- Treasury — Accumulation of superannuation across a lifetime — MARIA projections of median balances by age cohort and income level over the next 40 years.
- Reserve Bank of Australia — commentary on super sector growth drivers, policy uncertainty, and the transition to drawdown.
- Deloitte — Dynamics of the Australian superannuation system — system-level projections and analysis of the drawdown challenge for retirees.
- ASFA — Super and the economy — system asset data, allocation trends, and the role of diversification in long-run returns.
- ATO — Super and planning for retirement — authoritative guidance on contribution caps, carry-forward rules, and consolidation.
- MoneySmart — Work out how much you need to retire — ASFA Retirement Standard figures and budgeting tools for retirement income planning.
This article is general information only and does not constitute financial or tax advice. Confirm current contribution caps, tax rates, and eligibility rules with the ATO or a qualified financial adviser before making decisions about your superannuation.