
Portfolio risk is the standard deviation of your portfolio's returns, and you calculate it by combining each asset's volatility with how those assets move together. For two assets, the formula is:
σ_p = √(w₁²σ₁² + w₂²σ₂² + 2w₁w₂ρσ₁σ₂)
Here's the three-step process:
- Gather the weight and standard deviation (volatility) of each asset in your portfolio.
- Estimate the correlation or covariance between each pair of assets from historical returns.
- Plug the numbers into the variance formula, then take the square root to get portfolio standard deviation.
Key Takeaways
Portfolio risk calculation comes down to combining each asset's volatility with the correlation between them, since that cross-term determines how much diversification actually reduces risk.
| Point | Details |
|---|---|
| Use the right formula | Two-asset portfolios use σ_p = √(w₁²σ₁² + w₂²σ₂² + 2w₁w₂ρσ₁σ₂); larger ones need the matrix form w′Σw. |
| Correlation drives diversification | Any ρ below +1 pulls portfolio σ below the weighted average of individual asset volatilities. |
| Match the metric to the question | Use standard deviation for total risk, Sortino or drawdown for downside risk, and beta for market sensitivity. |
| Estimation quality matters | Sample covariance from short or unstable data periods produces noisy, unreliable correlation estimates. |
| Automate for multi-asset portfolios | Alphaiq's modelling tools build covariance matrices and run stress tests across shares, property, and super automatically. |
Table of Contents
- What portfolio risk actually measures
- Calculate portfolio risk: the core formulas
- Estimating covariance and correlation from real data
- A worked two-asset example, plus Excel and Python
- Beyond standard deviation: Sharpe, Sortino, VaR and drawdown
- Reducing portfolio risk once you know the number
- The measure-matching rule experts actually follow
- How I actually use these numbers in practice
- Let a modelling tool handle the covariance matrix for you
- Frequently asked questions
- Sources
What portfolio risk actually measures
Standard deviation measures how far your portfolio's returns swing around their average, in both directions. It captures total volatility, not just the losses, which makes it the right yardstick when you're asking "how bumpy is this whole portfolio's ride?"
It's the wrong tool for other questions. If you want to know your worst-case loss, standard deviation won't tell you. If you want to know how a small satellite holding behaves inside a much larger fund, beta answers that better than a stand-alone volatility figure. Genesis Risk Monitor's rundown on common risk metrics makes the same point: standard deviation, drawdown, and VaR each answer a different question, and picking the wrong one skews your read on how risky a portfolio really is.
- Total volatility question → standard deviation
- Downside-only question → Sortino, VaR, CVaR
- Worst historical loss → maximum drawdown
- Sensitivity to the broader market → beta
Pro Tip: Before you calculate anything, write down the actual question you're trying to answer. "How risky is this portfolio on its own?" and "how sensitive is this portfolio to a market crash?" need different formulas entirely.
Calculate portfolio risk: the core formulas
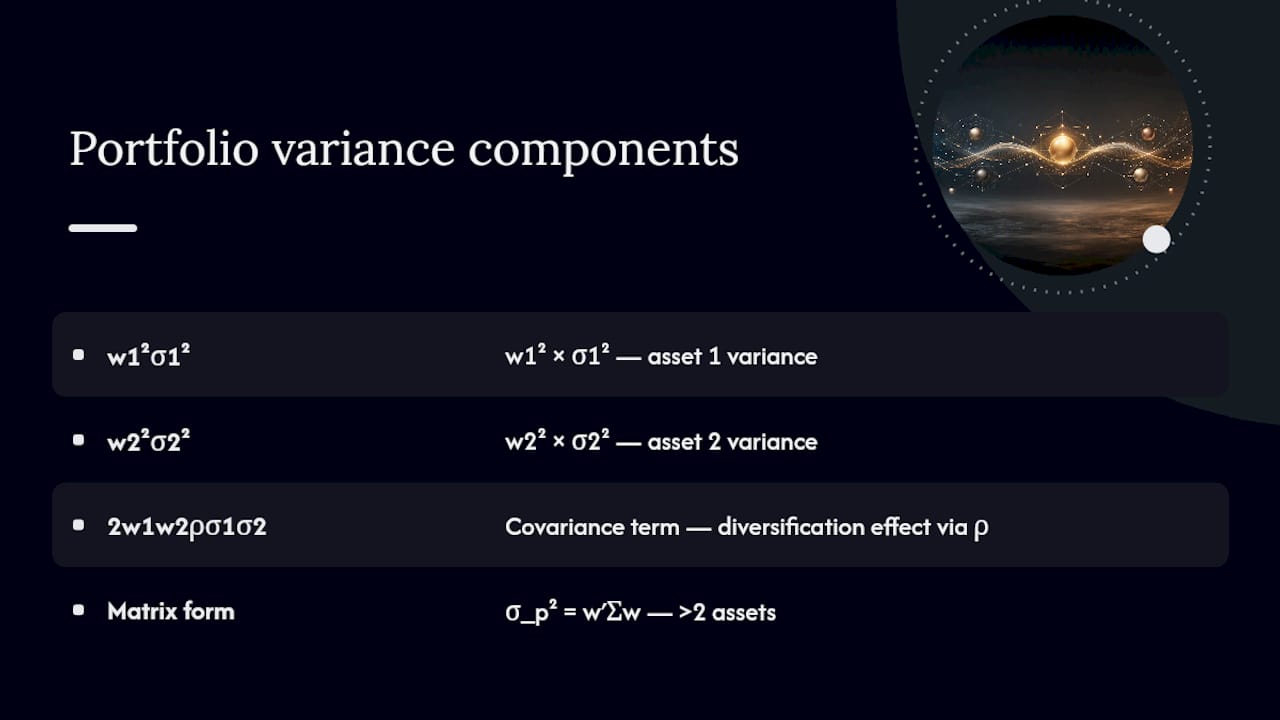
The two-asset formula does the heavy lifting for most self-directed portfolios with a handful of holdings:
σ_p² = w₁²σ₁² + w₂²σ₂² + 2w₁w₂ρσ₁σ₂
Then σ_p = √σ_p². Here, w₁ and w₂ are the portfolio weights, σ₁ and σ₂ are each asset's standard deviation, and ρ is the correlation coefficient between the two assets' returns.
Once you move past two holdings, the matrix form takes over: σ_p² = w′Σw, where w is your vector of portfolio weights and Σ is the covariance matrix of every asset pair. This version is behind most portfolio software, and it is the same matrix identity used to cross-check two-asset VaR calculations.
Expected portfolio return is a straightforward weighted average of each asset's expected return. Variance isn't, because of that cross-term, 2w₁w₂ρσ₁σ₂. That term is where diversification actually happens.
Any correlation ρ below +1 makes portfolio standard deviation strictly lower than the weighted average of the individual volatilities. The lower the correlation, the bigger the gap between the two.
That single fact, confirmed in Wall Street Oasis's breakdown of portfolio variance, is the entire mathematical case for owning assets that don't move in lockstep. Two volatile assets with low correlation can produce a portfolio that's calmer than either one on its own.
Estimating covariance and correlation from real data
You need historical return data before you can plug anything into the formula:
- Pull a price series for each asset, then convert prices into periodic returns (daily, weekly, or monthly).
- Pick a data frequency and lookback window. Daily data over one to three years is common for equities; monthly data suits slower-moving assets like property.
- Calculate the sample mean return, then the sample covariance between each pair of assets, dividing by n minus 1 rather than n.
- Annualise carefully: variance scales by the number of periods, but standard deviation scales by the square root of that number, per the annualisation conventions used in standard risk and return coursework.
Watch for non-stationarity. Correlations estimated from a calm five-year stretch can look nothing like correlations during a crisis, and a small sample size adds noise to every covariance you compute.
Pro Tip: If your lookback window is under two years of daily data, treat your correlation estimates as rough guides, not precise inputs. Short samples are where covariance estimates go wrong most often.
A worked two-asset example, plus Excel and Python
Take Asset A with expected return and volatility, and Asset B with expected return and volatility, with a portfolio weighted 60% A and 40% B, and correlation less than 1 between them.
- Expected portfolio return: (0.6 × 8%) + (0.4 × 5%) = 6.8%.
- Portfolio variance: (0.6² × 0.12²) + (0.4² × 0.06²) + (2 × 0.6 × 0.4 × 0.3 × 0.12 × 0.06) = 0.005184 + 0.000576 + 0.000311 = 0.006071.
- Portfolio standard deviation: √0.006071 ≈ 7.79%.
Notice that the portfolio standard deviation sits below the simple weighted average of the two volatilities, purely because of that correlation term.
In Excel, put weights in cells B1:B2, volatilities in C1:C2, and correlation in D1. Compute variance directly as =(B1^2*C1^2)+(B2^2*C2^2)+(2*B1*B2*D1*C1*C2), then wrap it in =SQRT() for standard deviation. For larger portfolios, use MMULT to multiply your weight vector against a covariance matrix built with COVARIANCE.S.
In Python, load your return series into a pandas DataFrame, call .cov() to get the covariance matrix, convert your weights into a NumPy array, and compute np.sqrt(weights @ cov_matrix @ weights.T). Keep your return units consistent (decimals, not mixed percentages) throughout, and check your figures against the VaR cross-check identity if you're validating a build.
Beyond standard deviation: Sharpe, Sortino, VaR and drawdown
Standard deviation tells you how much a portfolio moves; it doesn't tell you whether that movement is the kind you'd actually lose sleep over. Sharpe ratio adjusts return for total volatility, while Sortino ratio only penalises downside deviation, which makes it the sharper tool when capital preservation matters more than smoothing out upside swings, according to Charles Schwab's explanation of the Sortino ratio. Beta measures sensitivity to a market benchmark rather than total volatility.
Value at Risk (VaR) sets a loss threshold at a given confidence level; Conditional VaR (CVaR) goes further and estimates the average loss beyond that threshold, which is why risk practitioners favour CVaR for tail-risk decisions. Maximum drawdown, meanwhile, tracks the worst peak-to-trough loss a portfolio has actually suffered, giving you a real recovery-time gauge that complements volatility measures rather than replacing them.
| Metric | Question it answers | Typical interpretation |
|---|---|---|
| Standard deviation | How much does the portfolio swing overall? | Higher σ means wider return dispersion |
| Sharpe ratio | Is return worth the total volatility taken? | Above 1 is generally considered reasonable |
| Sortino ratio | Is return worth the downside volatility taken? | Higher is better; ignores upside swings |
| Beta | How sensitive is this to the market? | Tracks the market; above 1 amplifies it |
| VaR / CVaR | What's the plausible or average tail loss? | Stated at a confidence level |
| Maximum drawdown | What's the worst loss you'd have lived through? | Larger drawdowns mean longer recovery periods |
Reducing portfolio risk once you know the number
Once you've calculated σ_p, you have levers to pull:
- Rebalance toward assets with lower correlation to cut the variance cross-term.
- Set position sizing rules so no single holding can dominate your portfolio's risk profile, and review concentration risk specifically, since standard deviation alone can hide it.
- Use hedges (options, inverse positions) when a specific scenario, not general volatility, is the concern.
- Set a risk budget and a rebalancing cadence, then stress-test the portfolio against a market downturn scenario.
Pro Tip: Standard deviation misses liquidity risk entirely. A portfolio can show low σ and still be hard to exit quickly in a crisis, particularly with property or thinly traded stocks.
Pro Tip: Concentration risk and volatility aren't the same thing. Check weights, not just the headline number.
The measure-matching rule experts actually follow
Match the metric to the decision. Use total standard deviation when judging a portfolio on its own; use beta or Treynor when judging a sleeve inside a bigger allocation, a distinction Wall Street Oasis draws explicitly. Use Sortino or maximum drawdown when your real concern is losses, not symmetrical swings, and reach for VaR or CVaR when you need a tail-risk figure tied to a specific confidence level.
- Forecasting returns → standard deviation and expected return
- Judging loss tolerance → Sortino, maximum drawdown
- Benchmarking against the market → beta, Treynor ratio
Pro Tip: If you can't decide between VaR and drawdown, use drawdown first. It's based on what actually happened, not a probability assumption, which makes it easier to explain to yourself when markets get volatile.
How I actually use these numbers in practice
I compute σ_p first, then check maximum drawdown against it, because a portfolio's textbook volatility and its real-world worst day don't always agree. A quick spreadsheet handles the two-asset case; anything larger, I run through a short Python script for the covariance matrix, mostly because it's faster to rerun after a rebalance. Every one of these calculations assumes returns behave normally and relationships stay stable over time. Neither assumption survives a genuine crisis intact.
Let a modelling tool handle the covariance matrix for you
Building a covariance matrix by hand works fine for two assets. It gets tedious fast once your portfolio spans shares, property, and superannuation, and one transposed cell in Excel can throw your whole σ_p off. Alphaiq's modelling engine builds the covariance matrix automatically across your full position set, exports the working straight to a spreadsheet, and runs drawdown backtests and stress scenarios without you rebuilding formulas each time your weights shift.

That matters most for Australians juggling investments alongside superannuation and property, where correlation between asset classes changes the whole risk picture in ways a simple two-asset formula can't show. If you want to see how your own numbers behave under a downturn scenario, Alphaiq's Super Calculator is a practical next step, letting you model retirement income projections alongside your portfolio's risk profile in one place.
Frequently asked questions
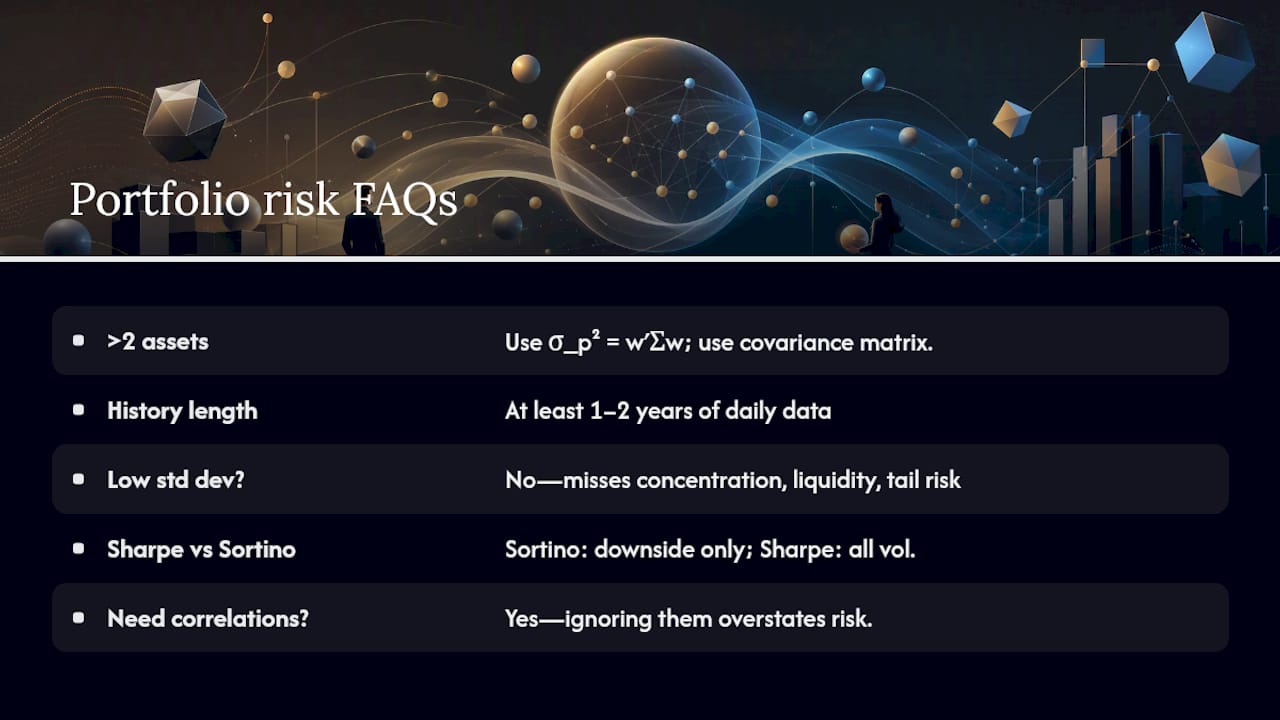
What's the simplest way to calculate portfolio risk with more than two assets?
Use the matrix form σ_p² = w′Σw, where w is your weight vector and Σ is the full covariance matrix of every asset pair. Spreadsheet functions like MMULT or a Python .cov() call handle this without manually expanding every cross-term.
How much history do I need to estimate correlation reliably? There's no fixed rule, but daily data spanning at least one to two years is a reasonable minimum for equities. Shorter windows produce correlation estimates that shift heavily with each new data point.
Does a low standard deviation always mean a safe portfolio? No. Standard deviation misses concentration risk, liquidity risk, and tail risk. A portfolio can show a low σ_p and still carry a dangerous single-position weighting or a hidden crash-day correlation spike.
Is Sharpe ratio or Sortino ratio better for measuring investment volatility? Sharpe penalises all volatility, upside and downside alike. Sortino only penalises downside deviation, which makes it a better fit for investors mainly worried about losses rather than any swing in returns.
Can I calculate portfolio risk without knowing the correlation between my assets? Not accurately. Skipping correlation and just averaging individual volatilities overstates portfolio risk in almost every case, because it ignores the diversification benefit that comes from assets not moving in perfect lockstep.
This article is general information, not a substitute for advice from a qualified financial advisor. Consult a qualified financial professional about your own circumstances before acting on anything here.
Sources
- Portfolio variance - Wall Street Oasis
- Portfolio VaR: Variance Study Guide | AskSia
- Using the Sortino ratio to gauge downside risk | Charles Schwab
- How to measure investment risk | Genesis Risk Monitor
- Portfolio Risk Measurement: A Practical Guide for Individual Investors | Portfolio Genius