
What is total return and why does it matter?
Total return is the complete measure of what an investment earns over a given period, combining capital appreciation with all income received, such as dividends, interest, and distributions. It's expressed as a percentage of the original amount invested, giving you a single figure that reflects the full picture of an investment's performance rather than just its price movement.
For Australian investors, this distinction carries real weight. A share might fall 5% in price over a year, yet still deliver a positive total return once dividends are included. Focusing only on price change would lead you to the wrong conclusion entirely.
Key aspects of total return:
- Combines capital gains (or losses) with all income received during the holding period
- Expressed as a percentage of the starting investment value
- Captures dividends, interest payments, and distributions
- Applies across all asset classes: shares, bonds, property, and managed funds
- Recognised by investment managers including Vanguard Australia as the standard measure for evaluating portfolio performance
How total return investing works as a strategy
Total return investing treats income and capital growth as a single unified pool rather than separate streams. Instead of relying on dividends or interest alone to fund living expenses, you draw from whichever source makes the most sense at any given time, whether that's income received, selling a portion of assets, or a combination of both.
The practical advantages of this approach are meaningful:
- Withdrawal flexibility: You control the timing and source of your drawdowns, rather than being locked into whatever income the portfolio happens to generate.
- Portfolio longevity: By not forcing income-heavy allocations, you preserve diversification and give your portfolio more room to grow.
- Downturn resilience: Holding bonds or cash as a buffer means you can fund expenses without selling equities at depressed prices.
- Reinvestment opportunity: Dividends received during market dips can be reinvested at lower prices, compounding growth over time.
Alphaiq is built to support exactly this kind of thinking. Its tax-aware modelling lets you model total return scenarios across your entire portfolio, including superannuation, property, and shares, so you can see the real numbers before making any decisions.
How to calculate total return: formula and components

The standard total return formula is:
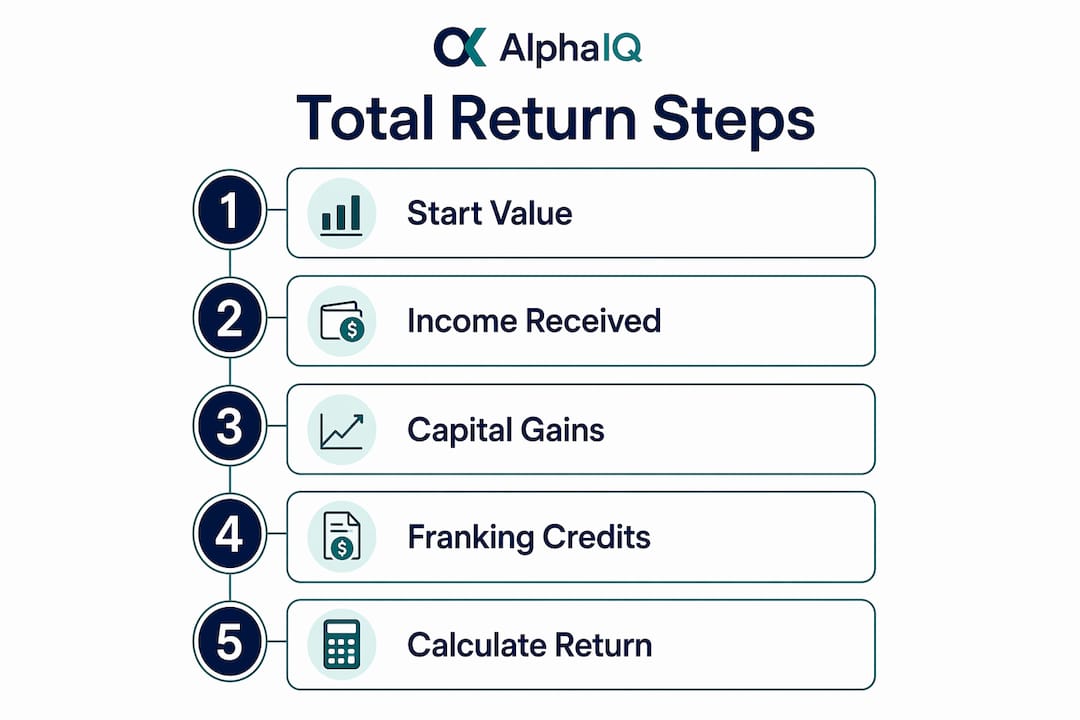
Total Return = (End Value − Start Value + Income Received) ÷ Start Value × 100%
Breaking this down:
- Start value: The original purchase price, including brokerage and transaction costs
- End value: The current market price or sale price of the investment
- Income received: All dividends, interest, franking credit refunds, and distributions collected during the period
Step-by-step example for an Australian share investor
- You buy 500 shares in an ASX-listed company at $10.00 each. Total outlay: $5,000.
- Over 12 months, the share price rises to $10.50. End value: $5,250.
- During the year, you receive $0.40 per share in fully franked dividends. Total income: $200.
- Apply the formula: ($5,250 − $5,000 + $200) ÷ $5,000 × 100% = total return
For Australian investors, franking credits add another layer. If those dividends were fully franked at the 30% corporate tax rate, the grossed-up value of the dividend is higher than the cash amount received, which affects your after-tax return depending on your marginal rate. Alphaiq accounts for franking credits directly in its modelling, so you see the tax-adjusted outcome rather than just the headline figure.
Pro Tip: Always include brokerage costs in your start value when calculating total return. Ignoring transaction costs overstates your actual gain, particularly on smaller positions.
Common misconceptions about total return investing
Several misunderstandings tend to follow this strategy around. Clearing them up makes the approach much easier to apply with confidence.
- "You have to sell shares in a downturn." This is the most common objection, and it's wrong. A well-structured total return portfolio holds bond or cash allocations specifically to fund living expenses during market falls, leaving equities untouched to recover.
- "High yield means high total return." Yield only measures annual income relative to price. An asset with a 7% yield but a falling price can still deliver a negative total return. Relying solely on yield misrepresents an investment's actual performance.
- "Income and growth are separate goals." Total return investing rejects this split. Treating them as unified removes the temptation to chase yield at the expense of diversification.
- "You need to generate enough income to live on." This constraint forces concentration into high-yield assets, which creates unintended risks including value traps and sector concentration.
- "Capital growth doesn't count if you don't sell." Unrealised gains still represent real wealth. A total return framework accounts for them as part of your overall financial position.
Net return versus total return: what Australian investors actually take home
Total return, as calculated by the formula above, is technically a gross figure. It doesn't account for the costs that reduce what you actually receive. Net return is what's left after fees, taxes, and expenses are deducted, and it's the number that reflects your real financial outcome.
The distinction matters in practice:
- Management fees: A managed fund charging 0.80% per annum reduces your net return by that amount every year, compounding over time.
- Brokerage and transaction costs: These reduce your effective start value and therefore your net gain.
- Tax on income: Dividends and interest are assessable income in Australia. Your marginal tax rate determines how much of that income you keep.
- Dividend withholding tax: For index investors, gross total return assumes full dividend reinvestment before any tax deduction, while net total return indices factor in withholding tax, giving a truer picture of what an investor actually receives.
- Inflation: Real return goes one step further, adjusting net return for the erosion of purchasing power.
Pro Tip: When comparing managed funds or ETFs, always check whether the reported return figure is gross or net of fees. A fund reporting gross total return will always look better than one reporting net, even if the underlying performance is identical.
Vanguard Australia publishes both gross and net return data for its index funds, which makes fee impact transparent. Using a tax calculator alongside your investment data helps you estimate the after-tax net return specific to your situation. Alphaiq builds this tax-aware layer directly into its modelling, so you're always working with net figures rather than headline numbers.
Total return versus income-only strategies
An income-only strategy funds living expenses entirely from dividends, interest, and distributions, leaving capital untouched. It sounds conservative, but it carries its own risks. To generate enough income, portfolios often tilt heavily toward high-yield shares, REITs, or hybrid securities, concentrating exposure in ways that increase volatility and sector risk.
Total return investing removes that constraint. Because you can draw from capital as well as income, you don't need to bias the portfolio toward yield. You can hold a genuinely diversified mix of growth and defensive assets, then withdraw from whichever source is most tax-efficient or least disruptive at any given time. Vanguard Australia describes this as a prudent spending rule approach, one that balances income needs with growth rather than sacrificing one for the other.
For Australian investors building toward retirement, the difference between strategies becomes most visible in a sustained low-yield environment, where income-only portfolios either fall short of spending needs or take on excessive risk to compensate.
Why total return gives you a clearer picture of investment performance
Price return tells you how much an asset's market value changed. Total return tells you how much wealth the investment actually created. For any asset that pays income, price return alone understates performance, sometimes dramatically.
Consider an Australian bond fund. Its unit price may barely move over a year, making it look like a poor performer on a price chart. But once you include the interest distributions it paid, the total return might be quite respectable for a defensive allocation. The same logic applies to high-dividend shares, listed property trusts, and infrastructure funds, all of which are common holdings in Australian portfolios.
Using total return as your benchmark also makes cross-asset comparisons fair. A growth share and a dividend share can both be evaluated on the same basis, without penalising one for returning value through income rather than price appreciation.
Comparing asset classes using total return metrics
Total return gives you a consistent basis for comparing very different asset types. Without it, you're comparing apples with oranges.

| Asset class | Primary return source | Income component | Key Australian consideration |
|---|---|---|---|
| Australian shares | Capital appreciation | Franked dividends | Franking credits boost after-tax return |
| Bonds and fixed income | Interest income | Coupon payments | Assessable as ordinary income |
| Listed property (REITs) | Capital appreciation | Distributions | Tax treatment varies by trust structure |
| International shares | Capital appreciation | Unfranked dividends | Foreign withholding tax applies |
| Cash and term deposits | Nil capital gain | Interest | Fully assessable, no franking benefit |
When you compare investment returns across these classes using total return, you account for every source of value each asset generates. A cash account with a competitive interest rate might outperform a growth share on a total return basis in a flat market year. Knowing that changes how you think about portfolio construction.
Alphaiq lets you model total return across all of these asset classes in one place, with Australian tax rules applied, so you can see which combination of assets is actually building your wealth most effectively.
Key takeaways
Total return is the only complete measure of investment performance, capturing both capital gains and income in a single figure that reflects what an investment actually delivers.
| Point | Details |
|---|---|
| Total return formula | (End Value − Start Value + Income) ÷ Start Value × 100% gives the full performance figure. |
| Net return is what you keep | Fees, taxes, and inflation reduce gross total return to the amount you actually receive. |
| Franking credits matter | Australian investors must include franking credit values to calculate accurate after-tax total return. |
| Income-only strategies carry risk | Yield-focused portfolios concentrate in high-risk assets; total return investing preserves diversification. |
| Bond buffers protect equity | Holding defensive assets funds expenses in downturns, letting equities recover without forced sales. |

See your total return in real numbers. Alphaiq models your investments, super, and property together with Australian tax rules applied, so you know exactly what you're earning and what you're keeping. Start modelling your portfolio today.