
TL;DR:
- Many Australian investors overlook investment fees, which silently erode long-term wealth through compounding.
- Reducing these fees significantly improves portfolio performance, as costs directly impact future returns.
Most Australian investors focus intently on picking the right assets, timing the market, or finding the next strong performer, yet they overlook one of the most reliable drains on their wealth: investment fees. 61% of Australians do not realise their super fund is charging them multiple fees, let alone how much those fees erode their long-term balance. This guide cuts through the confusion, showing you exactly how to identify every fee you pay, understand what drives them, and take practical steps to reduce their impact on your portfolio.
Table of Contents
- How investment fees impact your portfolio
- Types of investment fees Australians should watch
- Why reducing fees leads to better performance
- Fee visibility and comparison tools for Australians
- What most investors miss about managing investment fees
- How AlphaIQ helps Australians manage and optimise investment fees
- Frequently asked questions
Key Takeaways
| Point | Details |
|---|---|
| Fees erode returns | Investment fees directly and indirectly reduce your portfolio’s long-term growth. |
| Lower fees predict success | Funds with lower overall fees typically outperform costly competitors. |
| Know every fee type | Identifying product, service, and platform fees empowers more effective fee management. |
| Visibility enables action | Regulatory disclosure and tools help Australians compare and reduce investment fees. |
| Tech assists fee optimisation | Platforms like AlphaIQ simplify fee analysis so you can boost net returns. |
How investment fees impact your portfolio
Fees are not always obvious. Some come off your account balance directly, such as administration charges. Others are reflected in your daily unit price, meaning the fund deducts them before you ever see your return figure. Understanding both mechanisms is the first step in taking control.
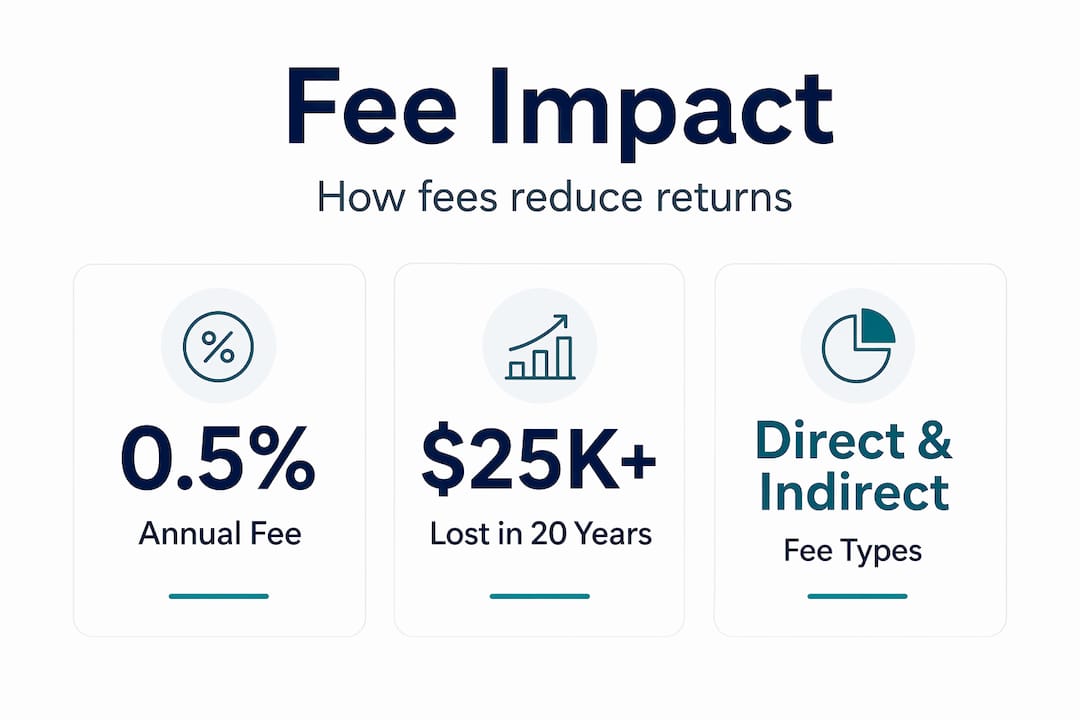
Investment fees reduce returns both directly and indirectly, and the compounding effect over time is where the real damage occurs. Consider a $200,000 portfolio growing at 7% per year. The difference between a 0.2% annual fee and a 1.2% annual fee may seem trivial in year one, but the gap widens dramatically over two decades.
| Starting balance | Annual return | Annual fee | Balance after 20 years |
|---|---|---|---|
| $200,000 | 7% | 0.20% | $728,000 (approx.) |
| $200,000 | 7% | 1.20% | $596,000 (approx.) |
| $200,000 | 7% | 2.00% | $503,000 (approx.) |
The difference between the 0.20% and 2.00% fee scenarios is more than $225,000. That is money that could fund years of retirement income, and it disappears silently without a single poor investment decision.
Key fee impacts to keep in mind:
- Direct deductions reduce your account balance in real time, immediately shrinking the base that compounds forward.
- Indirect (embedded) fees like management expense ratios (MERs) are deducted within the fund itself, so your published return is already net of these costs.
- ETF management fees are embedded in the fund and compound silently over time, making them easy to underestimate.
- Brokerage and transaction costs add up if you trade frequently, creating a drag that compounds just like any other fee.
"The single biggest difference between two otherwise identical portfolios over a 30-year horizon is often the fee structure, not the asset allocation."
Applying wealth management best practices means treating fee management as a core discipline alongside asset selection and rebalancing. It is not a one-time task. It requires ongoing attention.
Types of investment fees Australians should watch
Understanding your total fee drag starts with identifying all the underlying fee types. Australian investors typically face three broad categories, and each one requires a different approach to manage effectively.
A practical fee management methodology involves separating product, service/advice, and platform fees, then evaluating their combined drag on expected net returns. Here is how those categories break down:

1. Product fees (MER or ICR)
The Management Expense Ratio (MER) or Investment Cost Ratio (ICR) is the annual fee charged by a fund or ETF to cover its operating costs. For an index ETF, this might be 0.04% to 0.20%. For an actively managed fund, it can range from 0.75% to more than 1.5%. This fee is non-negotiable at the product level, which is why choosing a low-cost product matters so much upfront.
2. Service and advice fees
If you use a financial adviser or a managed account service, you may pay an ongoing advice fee, often expressed as a percentage of your portfolio or as a flat dollar amount. For self-directed investors, these fees are largely avoidable. If you are still paying trailing commissions or grandfathered advice fees from older products, it is worth reviewing whether you receive any value in return.
3. Platform fees
Investment platforms, including wrap accounts and super platforms, often charge their own layer of fees on top of the product fees. These can be percentage-based, tiered by balance, or flat annual charges. They are frequently overlooked because they appear as a separate line item in fine print.
| Fee type | Typical range | Negotiable? | Avoidable for self-directed? |
|---|---|---|---|
| MER / ICR | 0.04% to 1.50% | No | Yes (choose lower-cost products) |
| Service / advice fee | 0.50% to 1.00% | Yes | Yes (for self-directed investors) |
| Platform / admin fee | 0.10% to 0.70% | Sometimes | Yes (switch platforms) |
| Brokerage | $5 to $20+ per trade | No | Partially (reduce trading frequency) |
Pro Tip: Before comparing platforms, calculate your total fee as a percentage of your portfolio by adding your MER, platform fee, and any service charges together. That single combined number is what matters for your net return. Use tracking trading performance approaches to keep a record of all transaction-level costs too.
When reviewing your superannuation specifically, comparing an SMSF vs industry super fund involves looking at the total fee drag across all three categories, not just the headline administration fee. Similarly, if you are modelling how much super to retire at 60, your fee assumptions can shift the projected outcome by tens of thousands of dollars.
Why reducing fees leads to better performance
Once you know your fees, the key question becomes whether higher fees ever add value, or whether they simply drag down your results. The evidence is compelling and consistent.
Lower costs are strongly associated with better future performance outcomes because fees are a persistent headwind. The SPIVA Institutional Scorecard year-end 2024 confirms that the expense ratio is one of the most powerful predictors of long-term results across fund categories. This is not a subtle effect. It shows up clearly and persistently across markets, asset classes, and time periods.
"Fees are the one cost you can control with certainty. Investment returns are not. That asymmetry should guide your priorities."
Here is what the data consistently shows:
- The majority of actively managed funds underperform their benchmark index after fees are deducted, and this underperformance widens over longer time horizons.
- Even funds that outperform before fees often fail to beat the index once costs are factored in.
- Index funds and ETFs, which tend to carry significantly lower MERs, outperform most active competitors over 10 to 15-year periods simply by avoiding the fee burden.
- The higher the fee, the greater the performance hurdle a fund manager must clear just to match a passive alternative. Very few do so consistently.
This does not mean active management is always wrong. There are niche asset classes where specialised management genuinely adds value and where low-cost passive alternatives do not exist. But for broad market exposure, particularly Australian equities, global equities, and fixed income, the case for low-cost index strategies is strong.
Understanding algorithmic risk parameters used by institutional investors also reveals that even sophisticated risk-adjusted strategies prioritise fee minimisation as a foundational principle, not an afterthought.
Connecting fee reduction to your broader retirement plan means understanding how fees interact with investment risk. Learning how to manage investment risk while simultaneously reducing fee drag creates a compounding tailwind rather than a compounding headwind.
Fee visibility and comparison tools for Australians
Making fee management actionable means knowing where to find real fee data and how to use it. Australia's regulatory framework provides you with more transparency than many investors realise.
ASIC regulates fees-and-costs disclosure so investors can compare what they are paying. This means every super fund and managed investment scheme must disclose its fees clearly in its Product Disclosure Statement (PDS) and periodic account statements. You have the legal right to this information, so there is no excuse for not knowing what you pay.
Here is a step-by-step process for getting full fee visibility:
- Locate your PDS. Every super fund or managed fund must provide one. If you cannot find it, request it directly from the fund or download it from their website.
- Identify the ICR or MER. This is the annual percentage cost of holding the fund. It should be clearly labelled in the fees section of the PDS.
- Check your periodic statement. Your annual statement must show total fees paid in dollar terms for the year, not just percentages. Dollar amounts are often more confronting and more useful.
- Use the ATO's YourSuper comparison tool. This free government tool lets you benchmark your super fund's fees and performance against comparable options side by side.
- Add up all fee layers. Combine the MER, platform fee, and any advice fees to get your true total cost. This number should sit well below 1% for most self-directed investors.
Only 19% of Australians actively use fee-comparison tools when making investment decisions, leaving the majority paying more than necessary without realising it.
| Tool | What it compares | Cost | Best for |
|---|---|---|---|
| ATO YourSuper | Super fund fees and performance | Free | Super fund benchmarking |
| ASIC's Moneysmart | General investment fee education | Free | Understanding fee types |
| Fund PDS documents | Specific product fee disclosure | Free | Detailed product analysis |
| AlphaIQ platform | Portfolio-level fee and return modelling | Subscription | Holistic financial planning |
Pro Tip: Set a calendar reminder to review your fee disclosures once a year, ideally when your annual super statement arrives. Even a small fee reduction can compound into a significant improvement over a decade.
If you are working towards financial independence and calculating your FI number, plugging realistic post-fee returns into your projections is essential. Overestimating returns by ignoring fee drag is one of the most common modelling mistakes investors make. The AlphaIQ blog covers a range of scenarios that show how fee assumptions shift retirement timelines materially.
What most investors miss about managing investment fees
Fee management is often framed as a simple exercise: pick the cheapest option and move on. In practice, the picture is more nuanced, and missing these subtleties can cost you just as much as ignoring fees altogether.
The first thing most investors miss is the distinction between visible and embedded costs. Your MER is visible. But the bid-ask spread you pay every time you buy or sell an ETF is not. Neither is the capital gains tax triggered when a managed fund distributes realised gains to you at year end. The SPIVA After-Tax Scorecard highlights that embedded costs, including tax drag and transaction friction within funds, can be larger than the headline fee. A fund with a 0.30% MER but high internal turnover and frequent distributions could cost you more in real terms than a 0.60% MER fund with low turnover and tax-efficient management.
The second nuance is that fee minimisation is a strong default, but not an absolute rule. Morningstar's guidance makes clear that fee minimisation can be justified when a higher-cost product delivers superior net risk-adjusted returns after costs, or when a unique exposure is genuinely unavailable in a low-cost format. If you want access to private credit, infrastructure, or a highly specialised factor strategy, you may need to accept a higher fee in exchange for an exposure that genuinely diversifies your portfolio.
The third issue is behavioural neglect. Most investors review their asset allocation at least occasionally, but far fewer review their fee structure with the same discipline. Platforms, products, and fee schedules change. A platform that was competitive three years ago may no longer be. An adviser arrangement that was appropriate when your portfolio was smaller may now be disproportionately expensive.
Understanding tax-free retirement income strategies also intersects with fee management because tax drag and fee drag work together. Structuring your portfolio to minimise both simultaneously requires looking at the full picture, not just the fee line on your statement. Tools that model AI risk management approaches show that sophisticated investors treat tax and fee optimisation as one integrated discipline.
The honest takeaway: reviewing your fees once, switching to a cheaper option, and walking away is a good start. But real fee management is an ongoing practice, not a single event.
How AlphaIQ helps Australians manage and optimise investment fees
Having learned the essentials, here is how to apply technology for smarter fee management.
Understanding your fees intellectually is one thing. Quantifying their actual impact on your specific situation, across super, investments, and property, is where most Australians get stuck.
AlphaIQ is built precisely for this. The AlphaIQ platform lets you model your total financial position with tax-aware scenario simulation, so you can see exactly how different fee levels affect your projected retirement balance and income. Use the superannuation calculator to test what switching to a lower-fee super fund does to your projected outcome over 10, 20, or 30 years. If you are exploring strategies like debt recycling, the debt recycling calculator helps you factor in all associated costs so your net return assumptions stay realistic. This is the kind of clarity that replaces guesswork with confidence.
Frequently asked questions
Do all funds charge the same fees?
No, fees vary significantly between funds and products. Lowest-cost funds typically outperform otherwise identical higher-cost options over time, making fee comparison an essential part of product selection.
Where can I find my investment or super fees?
Check your product disclosure statement and your annual account statement for dollar-amount fee disclosures. Fees must be clearly disclosed in both documents, and the ATO's YourSuper tool is a practical starting point for benchmarking your super fund.
How much can small fee differences cost me over 20 years?
Even a 0.5% annual fee difference can reduce your final balance by tens of thousands of dollars. The compounding impact of fees over long time horizons is substantial because every dollar lost to fees also loses its future compounding potential.
Can I negotiate or avoid investment fees?
Some fees are non-negotiable at the product level, but platform and adviser charges are often flexible. Advice and platform charges may be negotiable or entirely avoidable for self-directed investors, so it is always worth asking your provider directly before renewing or committing to a new arrangement.